
Articles and Insights from
Chicago Winter Company
Speed up your PowerPoint work by using our custom toolbar
Some of PowerPoint’s best features for attorneys are the hardest to find. Use a custom toolbar to keep them accessible and speed up your workflow.
Powerpoint has a lot of features. Some are obvious, but many of the most useful commands for lawyers are buried deep within panels and hard to find.
Perhaps the most useful feature in the software is not even turned on by default: the “Quick-Access Toolbar”. It allows you add your choice of commands to a toolbar that conveniently sits right above your workspace, no matter what panel you’re in.

Things like grouping, rotating, changing object order and color, aligning — these all can be done right from the toolbar, without right-clicking objects or navigating between subpanels.
We’ve put together some of our favorite commands we think are most useful for lawyers in this toolbar. Learn how to download and install it at the end of this article.
Here’s a quick walkthrough of the features we’ve added to our recommended toolbar:

Pick up Style and Apply Style
One of the most important and time-saving features hidden in PowerPoint is the ability to “pick up” a style from an object or type — shape color, line weight, font or type size, line spacing, shadows, and more — and then apply those styles on a different object to make it match. It’s truly a swiss army knife of a tool to help keep your deck consistent, and one of our most frequent go-tos.
In the example above, an object style is Picked Up from the source object, the destination object is selected, and then Apply Style is used to copy all the styling properties onto the destination object.

Adjust Colors and Lines
Next, we have four commonly-used controls to adjust type color, object fill color, line color, and line thickness.

Group and Ungroup
Quick access to grouping functions, helping to avoid the repeated right-clicking usually needed to group and ungroup.

Change order (Stacking)
Easy access to the four commands that change stacking order of objects: Bring to Front (bringing an object all the way forward), Bring Forward (bringing an object only a single layer forward), Send Backwards (sending an object a single layer backwards), and Send to Back (sending an object all the way to the back).

Alignment, Centering, and Distribution
The alignment and distribution tools allow you to quickly snap groups of objects into relation with each other. Our toolbar begins with Align Bottom, Top, Left, and Right, which snap-align groups of objects to the edge chosen. They’re followed by by Align Objects Center (Vertically) and Align Objects Middle (Horizontal), which align shapes to a common center line. Distribute Horizontally and Distribute Vertically may be the least known of these tools: these functions space out a series of objects equally between the two furthest objects in the set.
In the example above, a group of objects is selected, followed by Align Objects Middle and then Distribute Horizontally, to bring the entire row into center alignment and then space them evenly.

Flip and Rotate
Next on our toolbar are commants to Flip (Mirror) Vertically and Flip (Mirror) Horizontally. Flip vertically and horizontally
Rotate clockwise and counterclockwise

Paragraph and Type size
Align type left, centered, and right
Increase and decrease font size

Set Transparent Color
Another hidden but incredibly effective tool, “Set Transparent Color” allows you to knock out the solid color background of an image, in order to let objects show through behind it — like highlighting. This feature requires the image to be reasonably good quality, however: if you attempt to use it on a grainy image like a poorly-scanned text document, you might notice it produces a lot of pixelated “artifacts” around the edges of the type, unable to cleanly find the edges.
Any changes made to an image using this tool can be reset by going to the Picture Format tab on the ribbon with your image selected, and clicking Reset Picture.

In the example above, a picture of a document has the Set Transparent tool applied to the “white” document background, making it transparent and allowing other objects to show through behind it — such as highlighting.

Crop Image
Easy access to the crop image tool, letting you pull in the edges of an picture (or image of a document) to focus in on a particular region.
Here’s how to install our custom toolbar:
Download the toolbar file here: PowerPoint Toolbar for Attorneys
Open Powerpoint, click the “File” tab, and go to “Options”
Select “Quick Access Toolbar”
Click the “Import/Export” button in the lower right.
Select “Import customizations file”
Select the toolbar file you downloaded.
Encouraged but optional: Check the box “Show Quick Access Toolbar below the Ribbon” — we find the toolbar easier to use when it’s on the bottom.
You should now see the custom toolbar appear below the Ribbon, ready to use.

Create better ideas for your graphics by using a roadmap
Ever wonder why graphics are so important in the courtroom? Science offers insights into how visual presentations affect jurors’ brains.
When it comes to generating good ideas to visualize your case, the overwhelming tendency is to begin by jumping right into brainstorming graphic concepts—torturing analogies for hours, or fixating on a particular visual.
It’s easy to get sideways (and over budget) with an unstructured, trial-and-error approach.
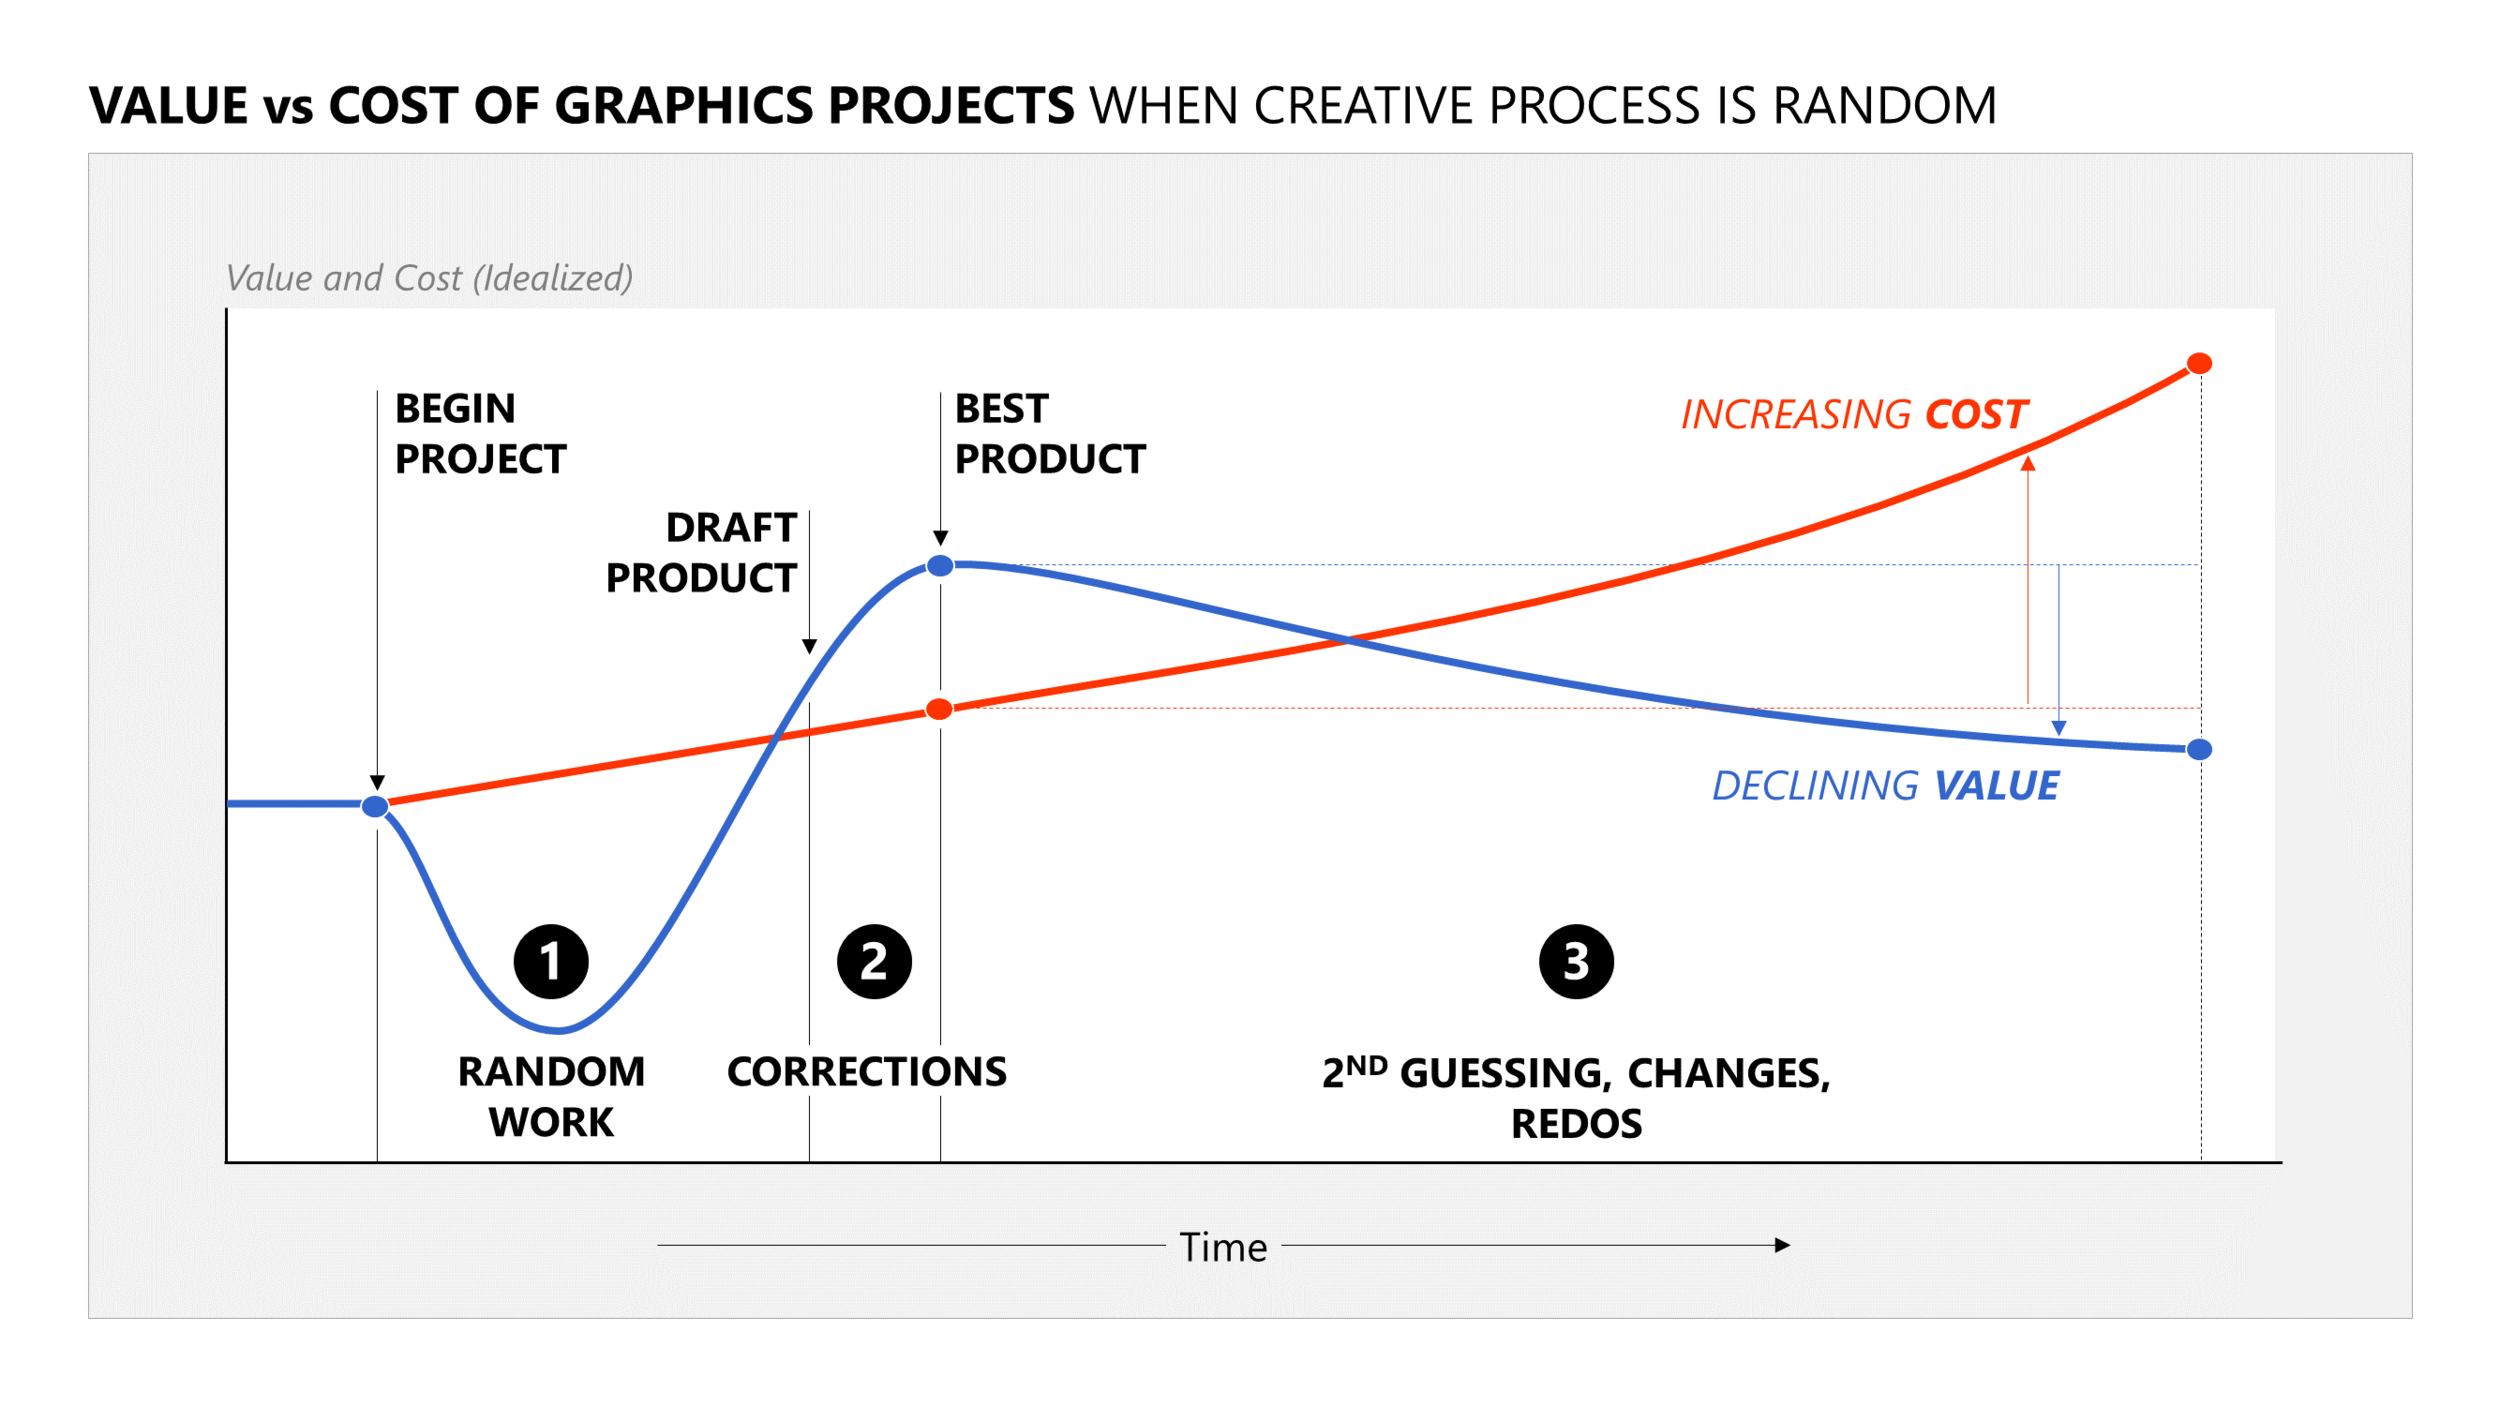
An idealized curve representing the productivity of a random creative process is shown, mapped against cost. We start with a trough of non-linear idea-seeking, followed by production of draft graphics. This is positive movement, and with corrections, the team reaches what tends to be the best product. This is too often followed by a period of second guessing, over-editing and re-doing. That 3rd period can be a huge cost driver, especially in a trial environment, and it can produce an actual decline in the quality and value of the product.
The alternative I offer begins with words, not pictures. Just as a script drives a movie, a considered roadmap should drive your graphics. When you practice this, good ideas just come to you—and they tend to be ideas born of your narrative, not pasted onto it.
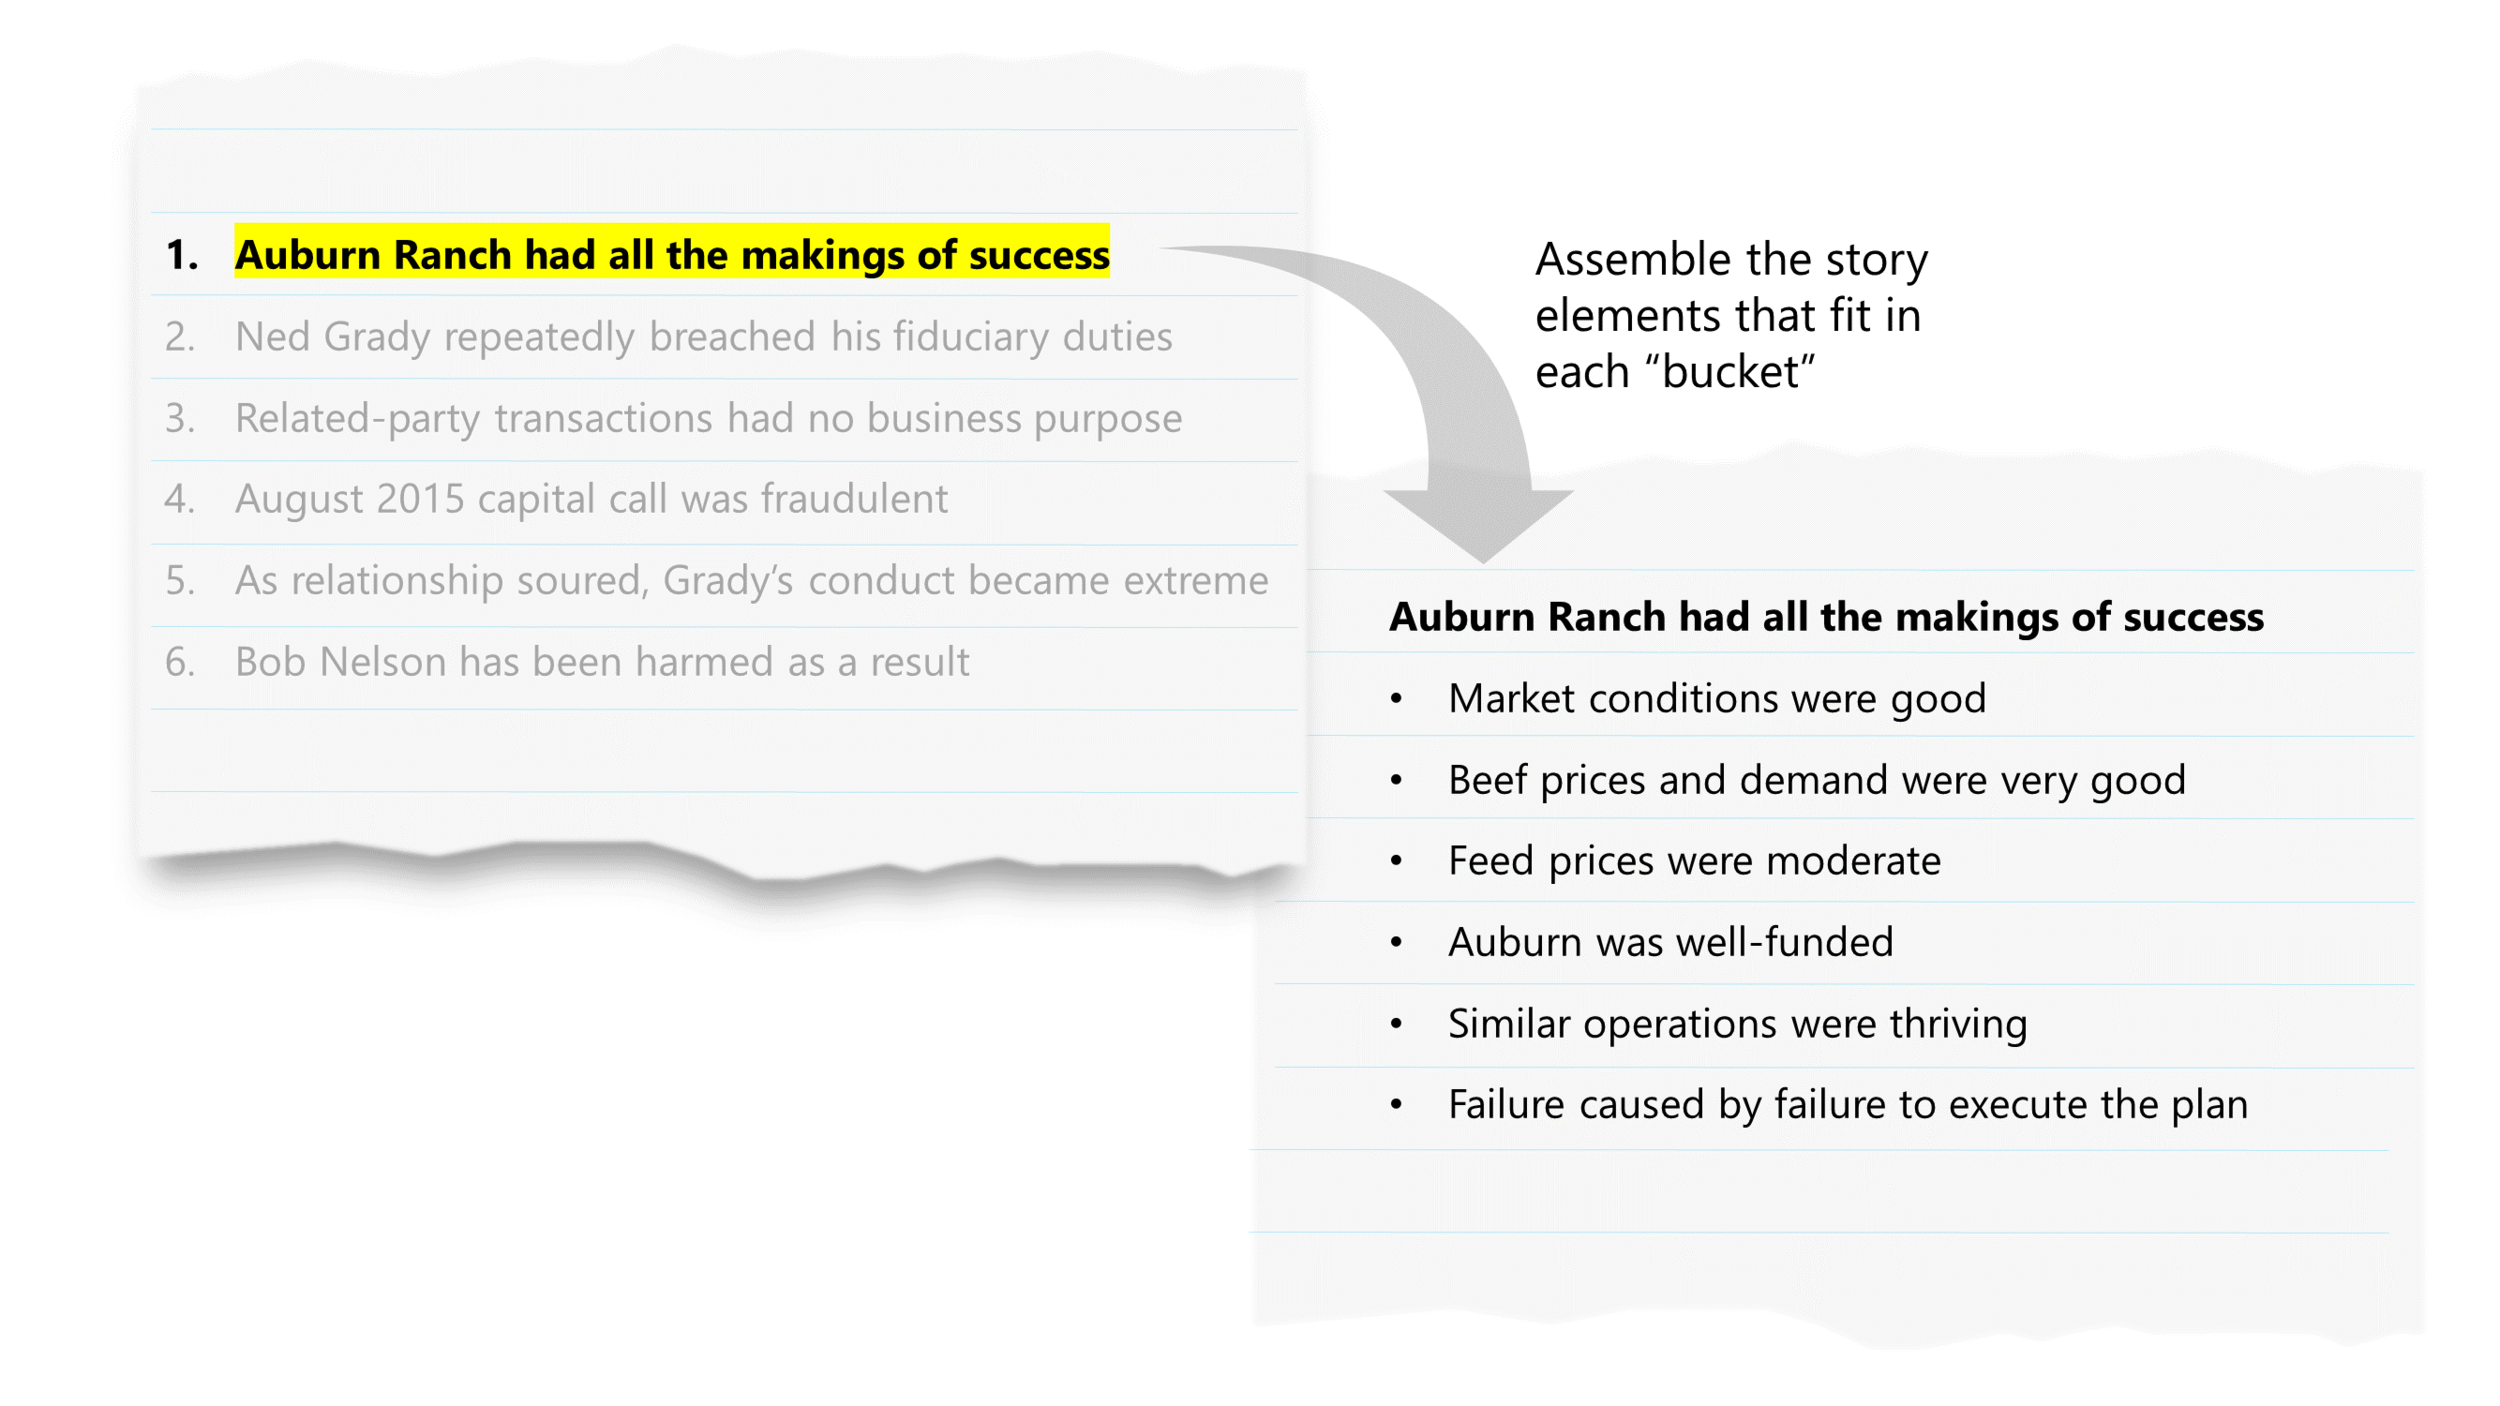
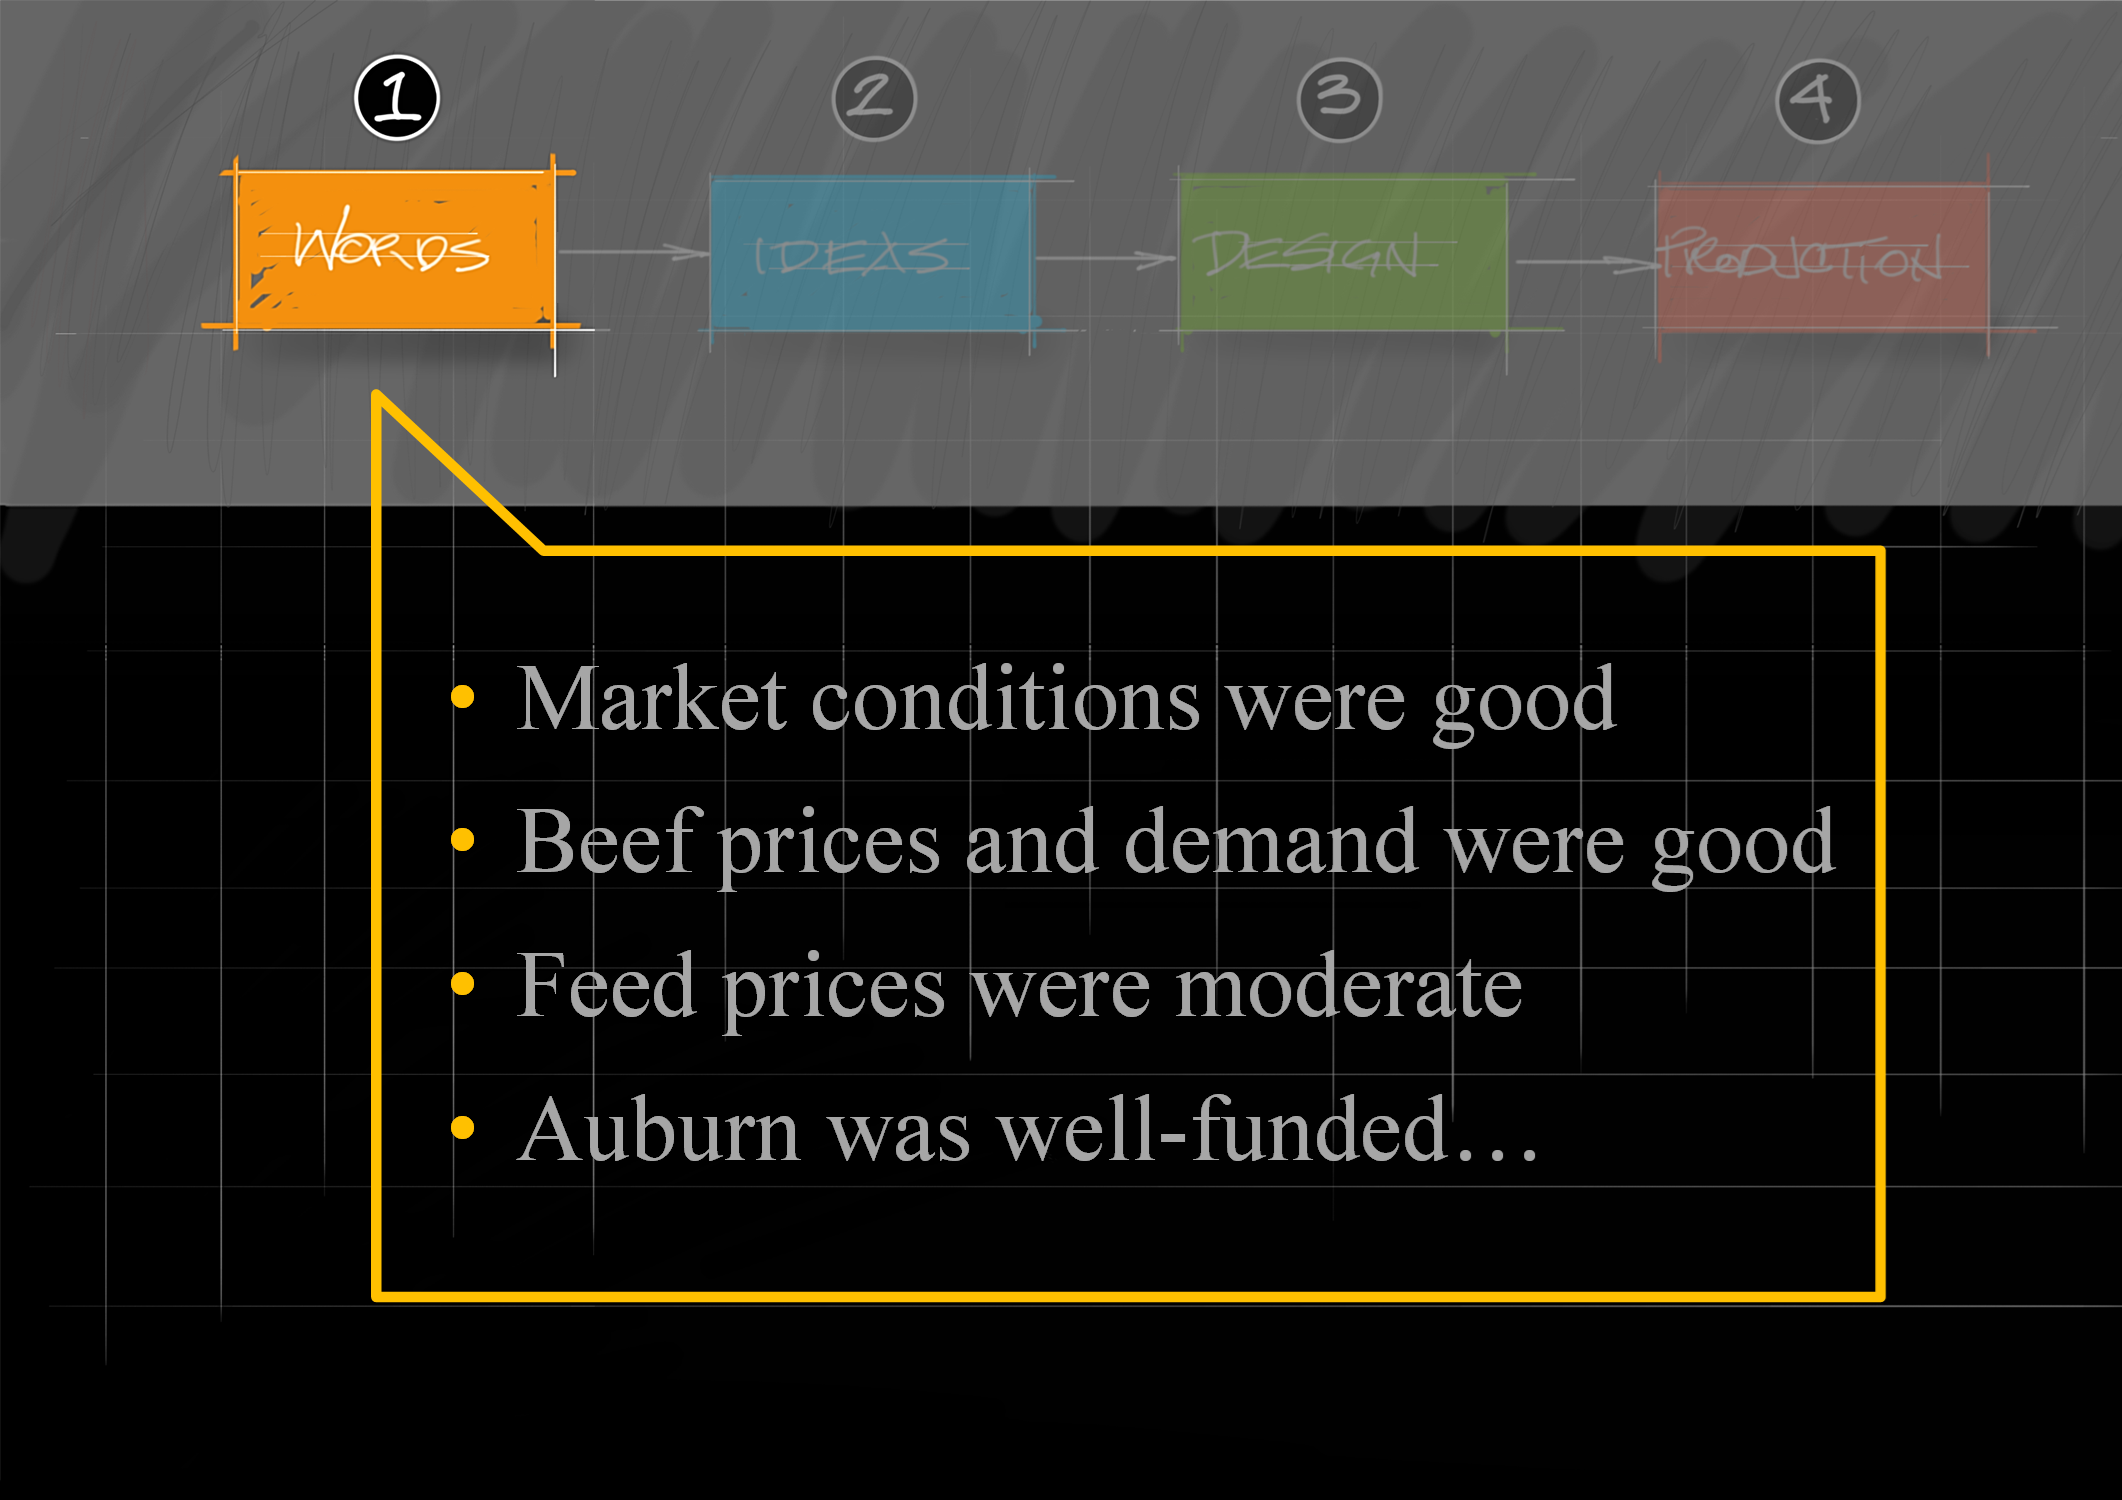
I recommend starting with drafting the big bullet points (usually 3-6) that represent the “chapters” or “buckets” your story fits into. Once you have filled the buckets with their narrative contents, you can plug in your evidence where it fits to best prove each point.
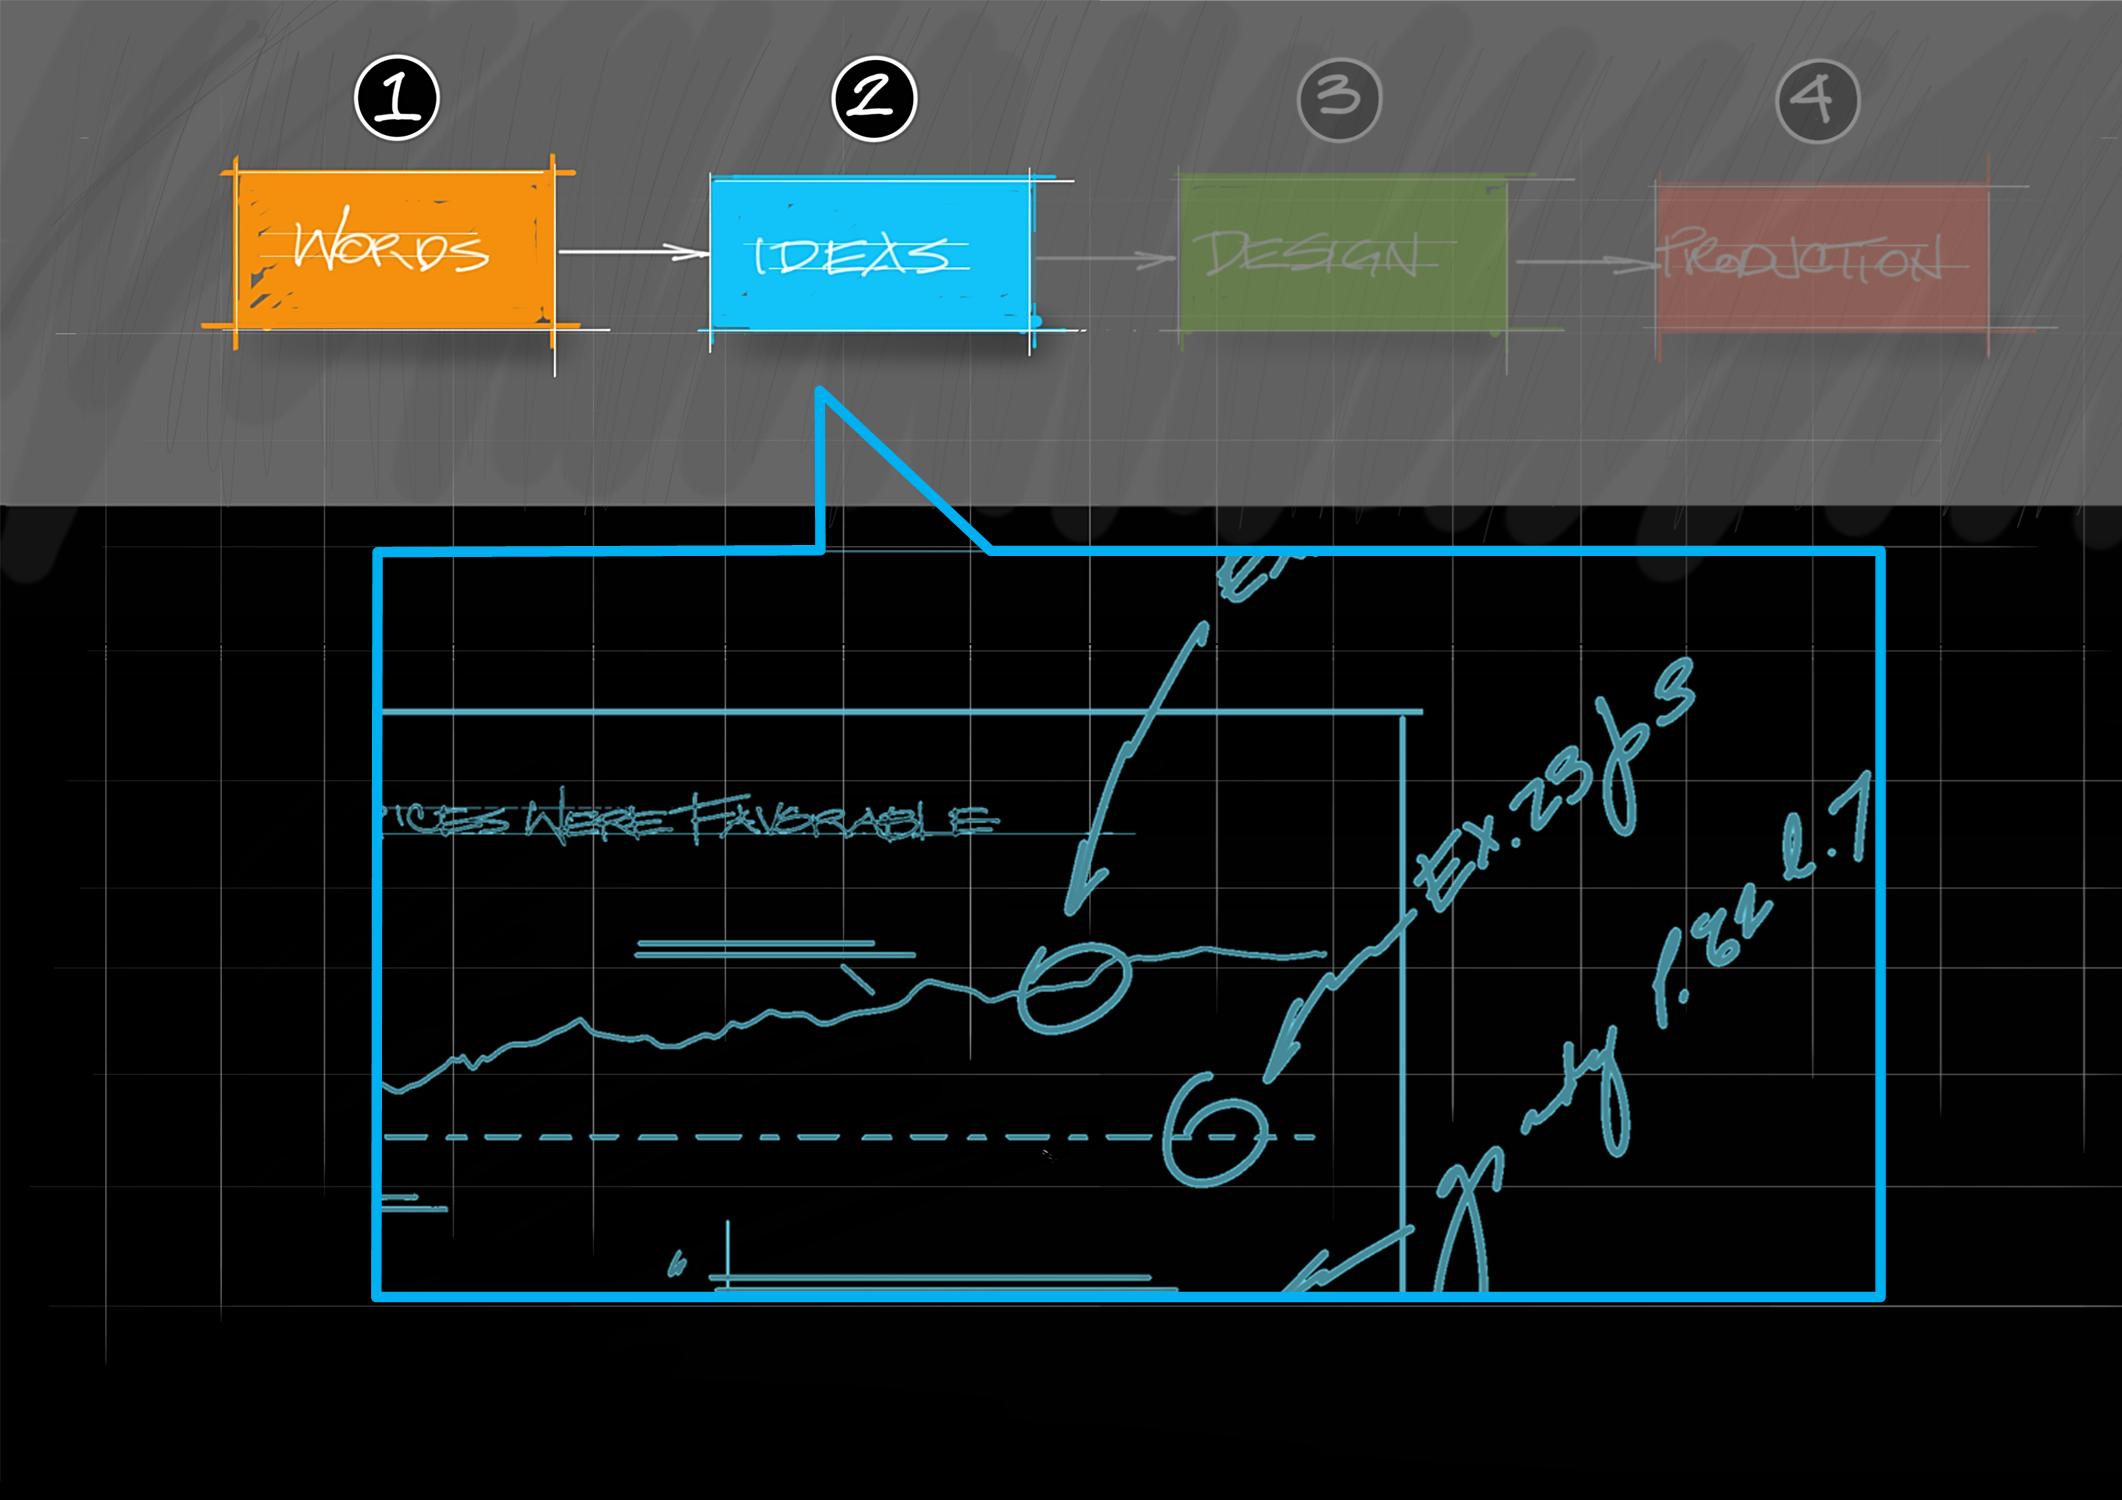
Here is the logical architecture described above, as you might outline for a deck to support your opening statement. It is in short-hand form mainly for ease of use, but that’s a good way to simplify your thinking too. This approach gives you a structure for considering how graphics fit in and help you tell your story. It also is useful as a way of diagramming how the evidence aligns with what you’re saying.
Now you have an outline that contains everything needed to create a rough “storyboard.” This is the part of the process that I still think is kind of magical: as you review your outline point-by-point, it becomes obvious what kind of image—be it evidentiary or demonstrative—goes with each point. Often you might come up with many concepts for the same issue, providing the luxury of trying multiple ideas to find out which might render the most solid graphic.
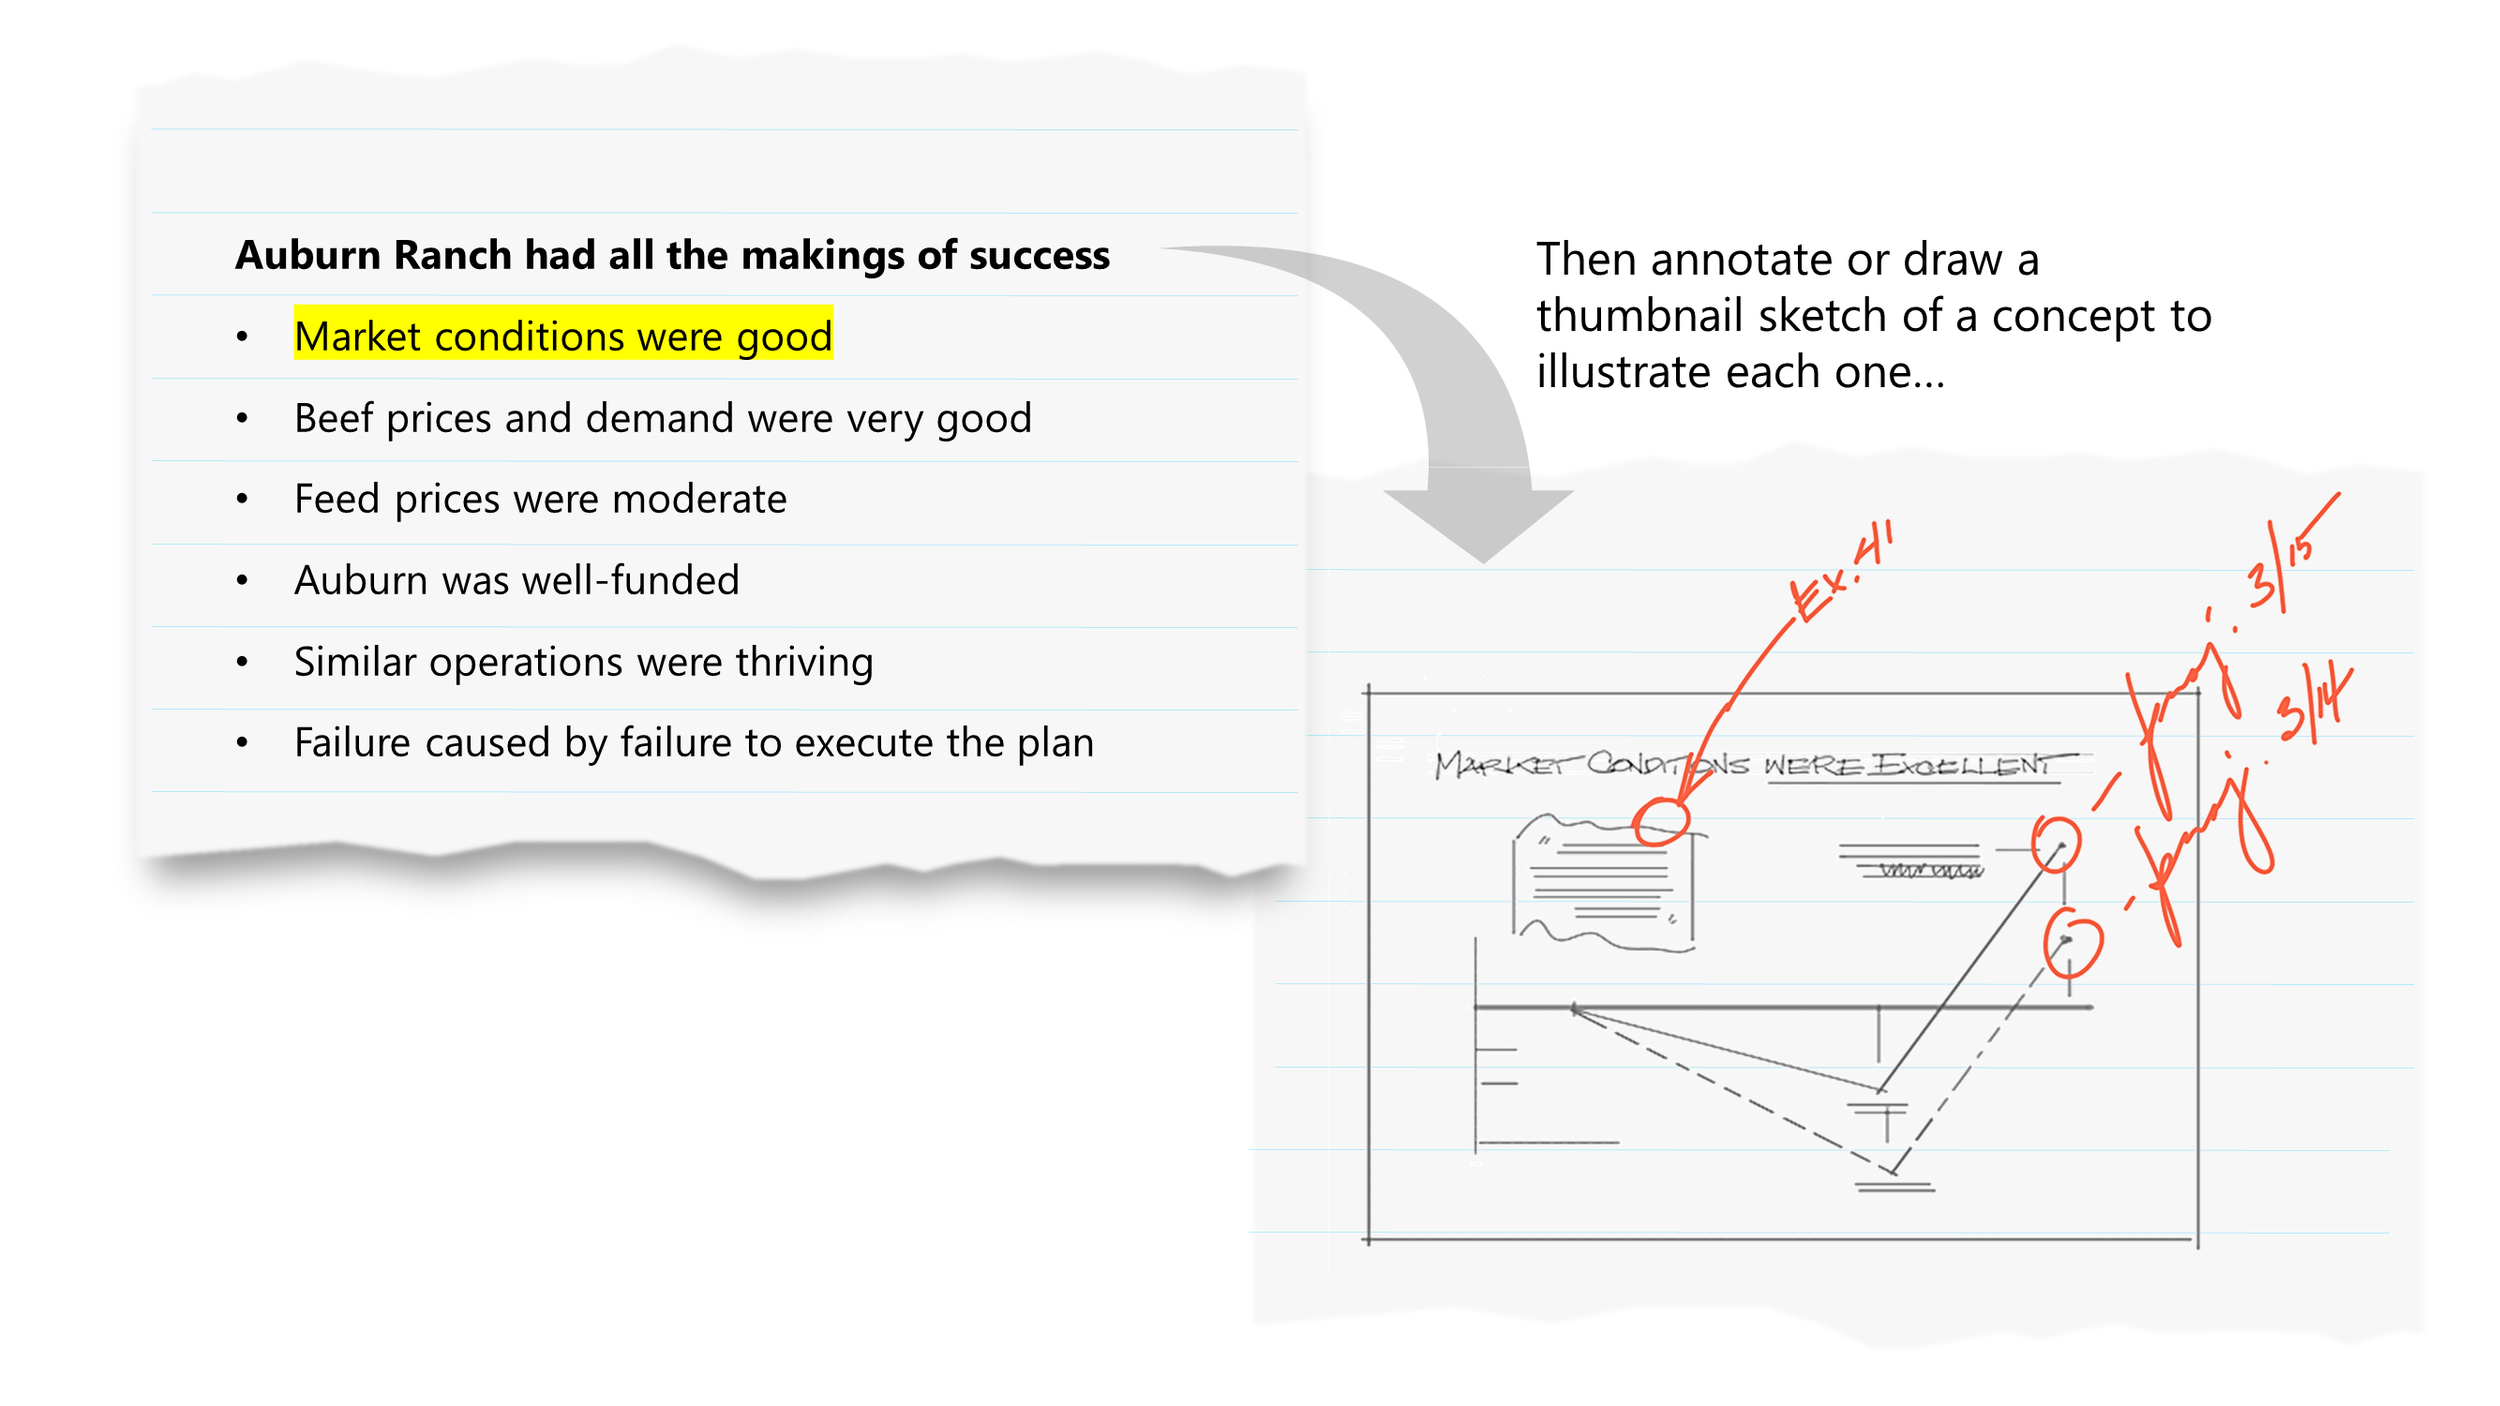
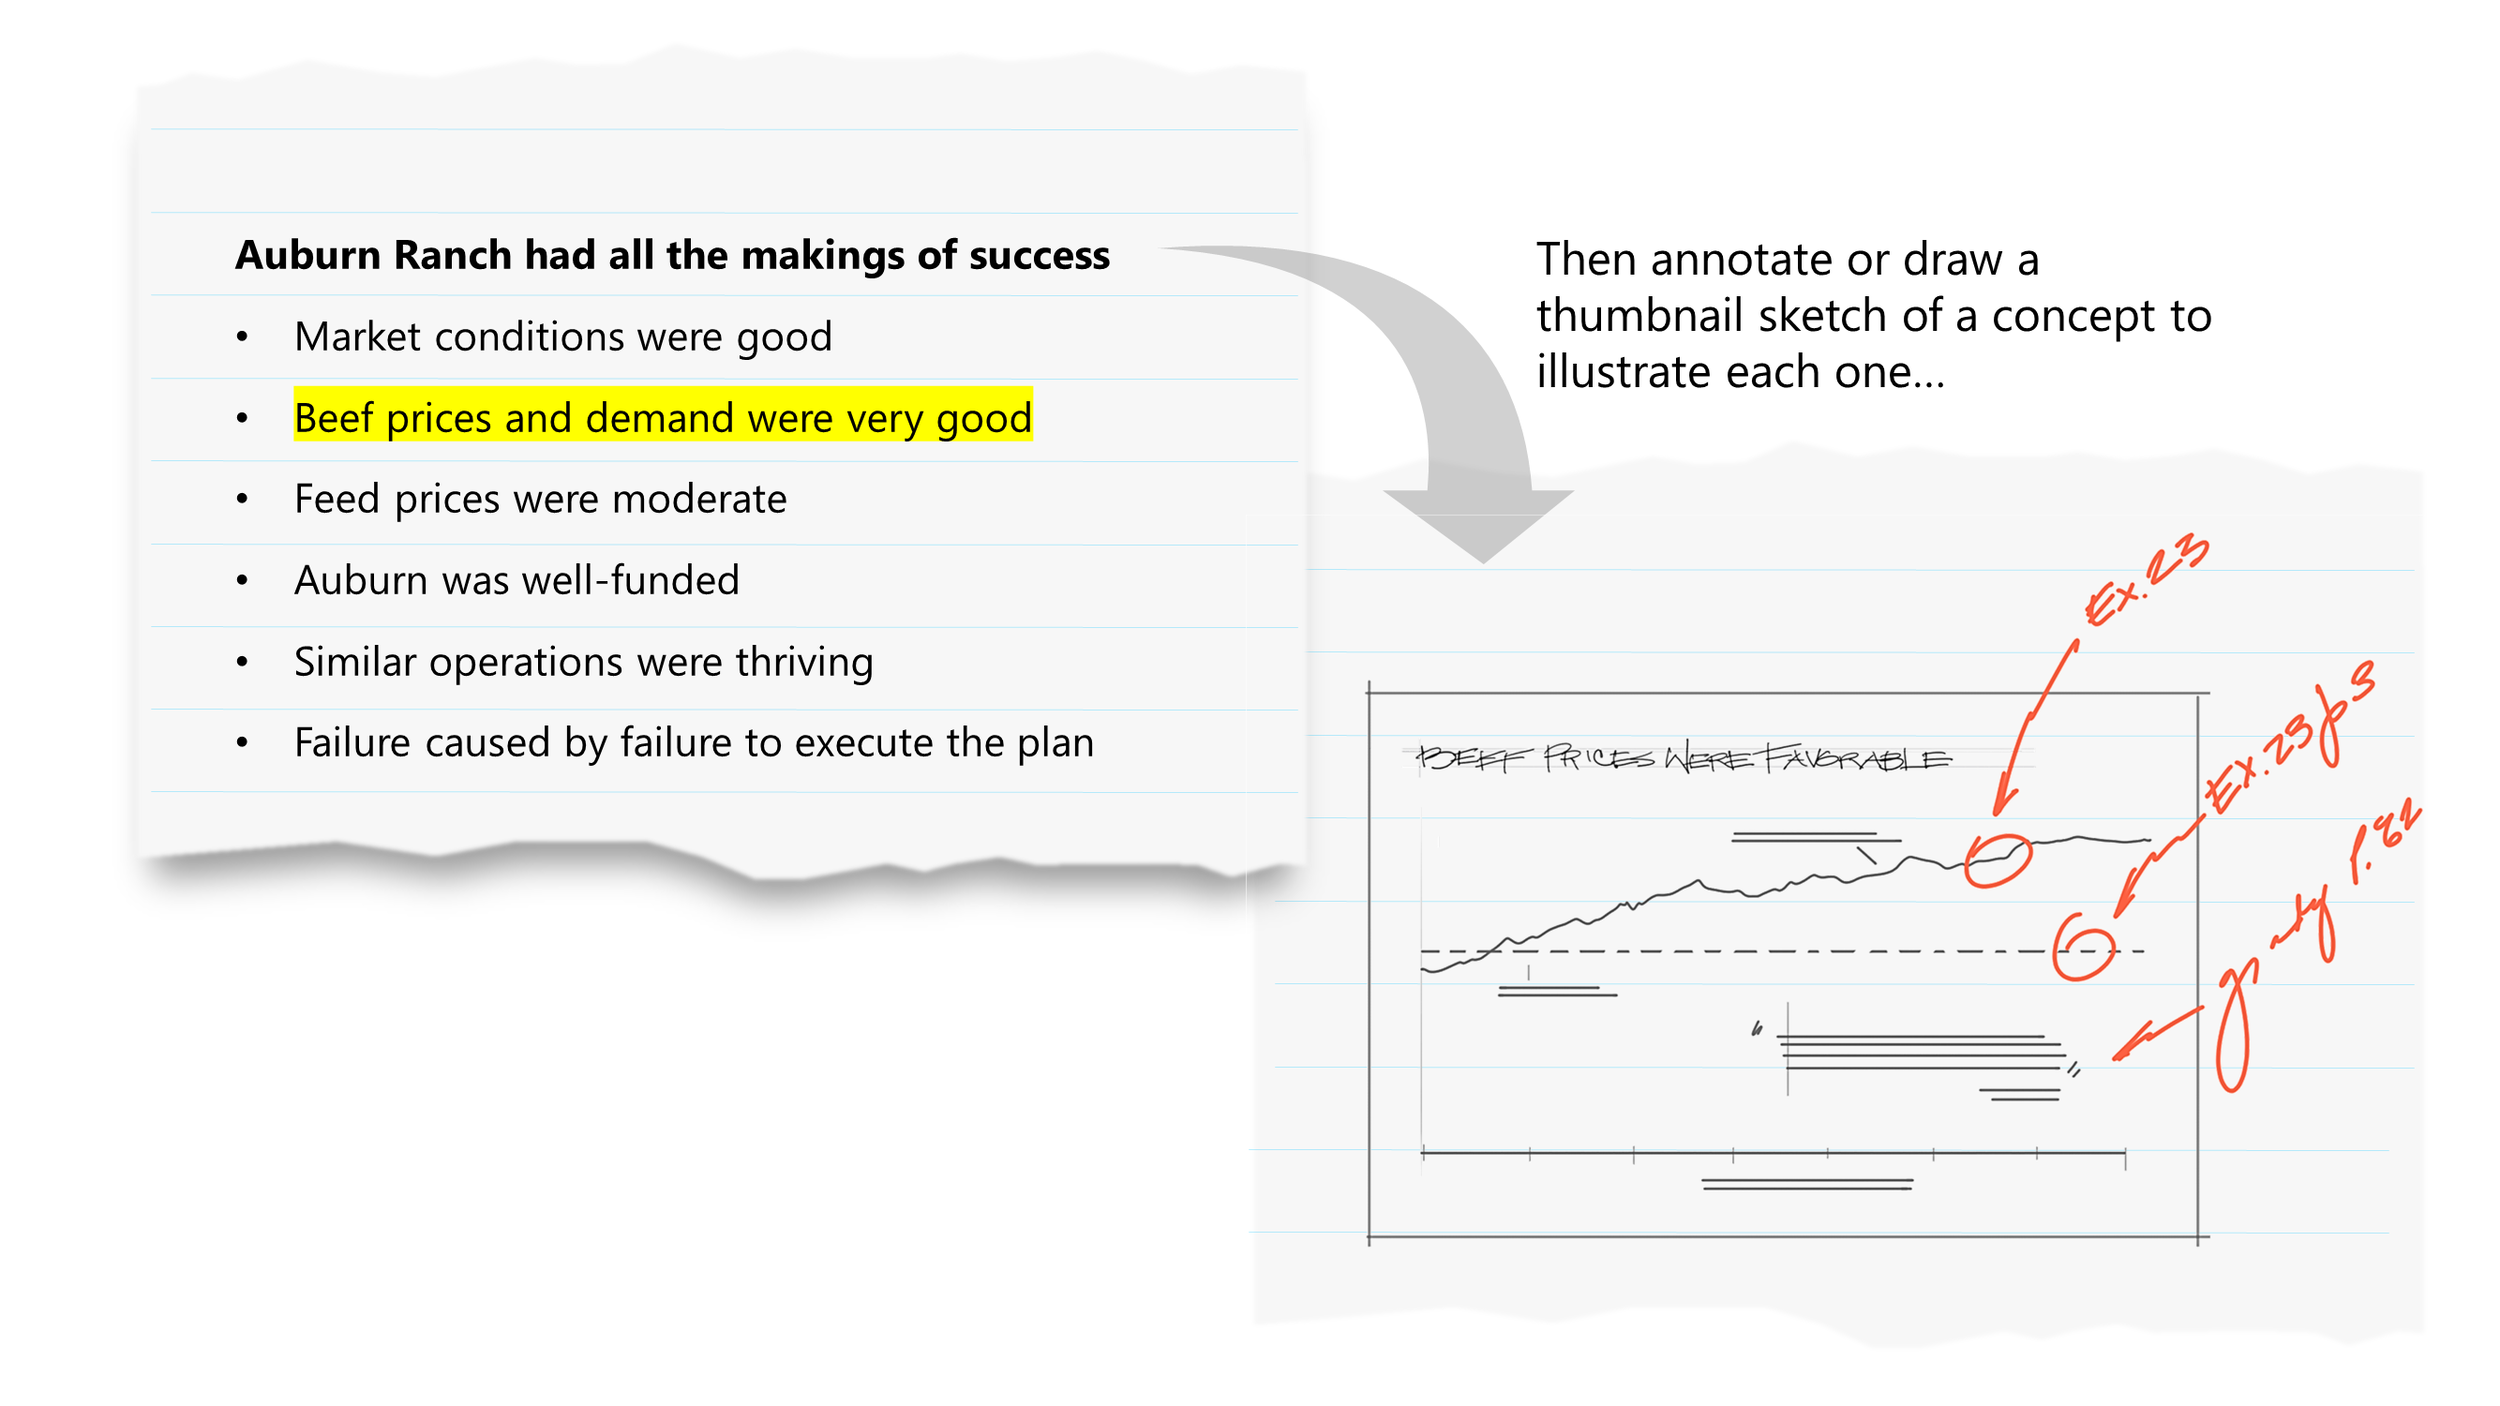
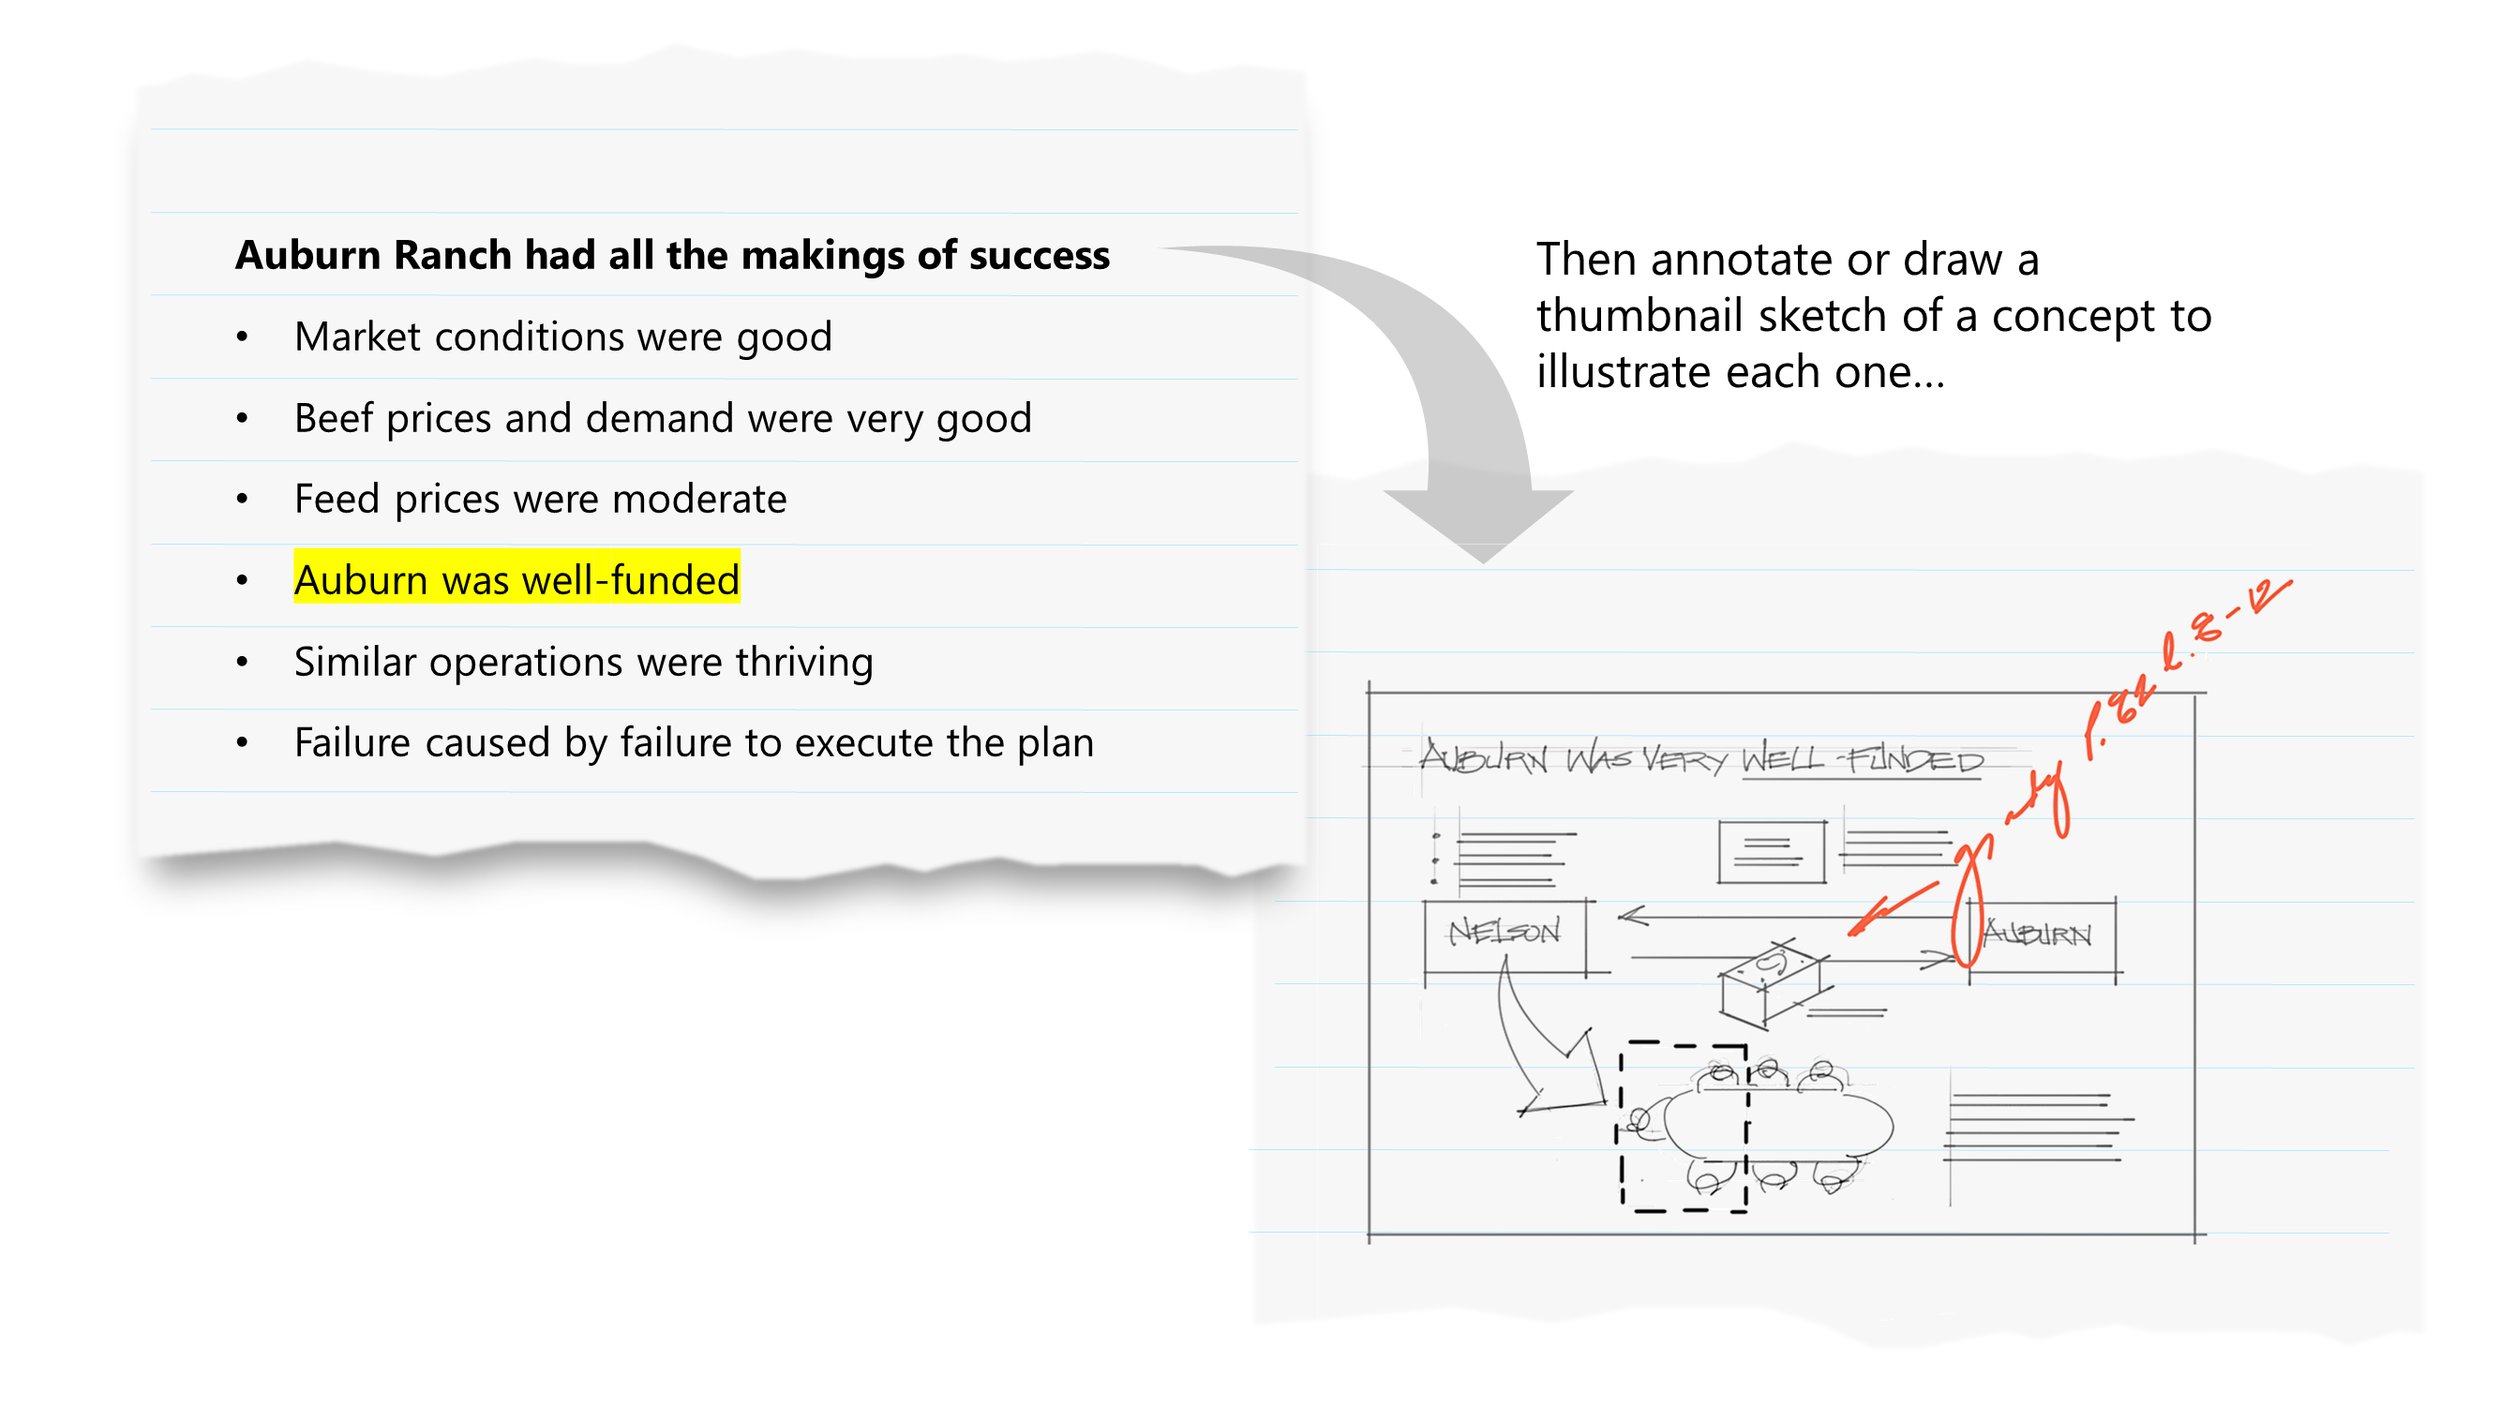
The discipline here is to let your words drive the pictures—if your outline is strong, your presentation will be as well. With simple notation or drawing stick figures, you can quickly create a skeleton of your presentation (oral argument, opening statement, expert deck or closing argument). This is a significant step beyond any likely product of a brainstorming session.
Here’s my process for building any graphic presentation, in a nutshell:
1) Assemble the narrative, even in rough bullet point form—what are you going to be saying?
2) Develop ideas for presenting the evidence, data and arguments;
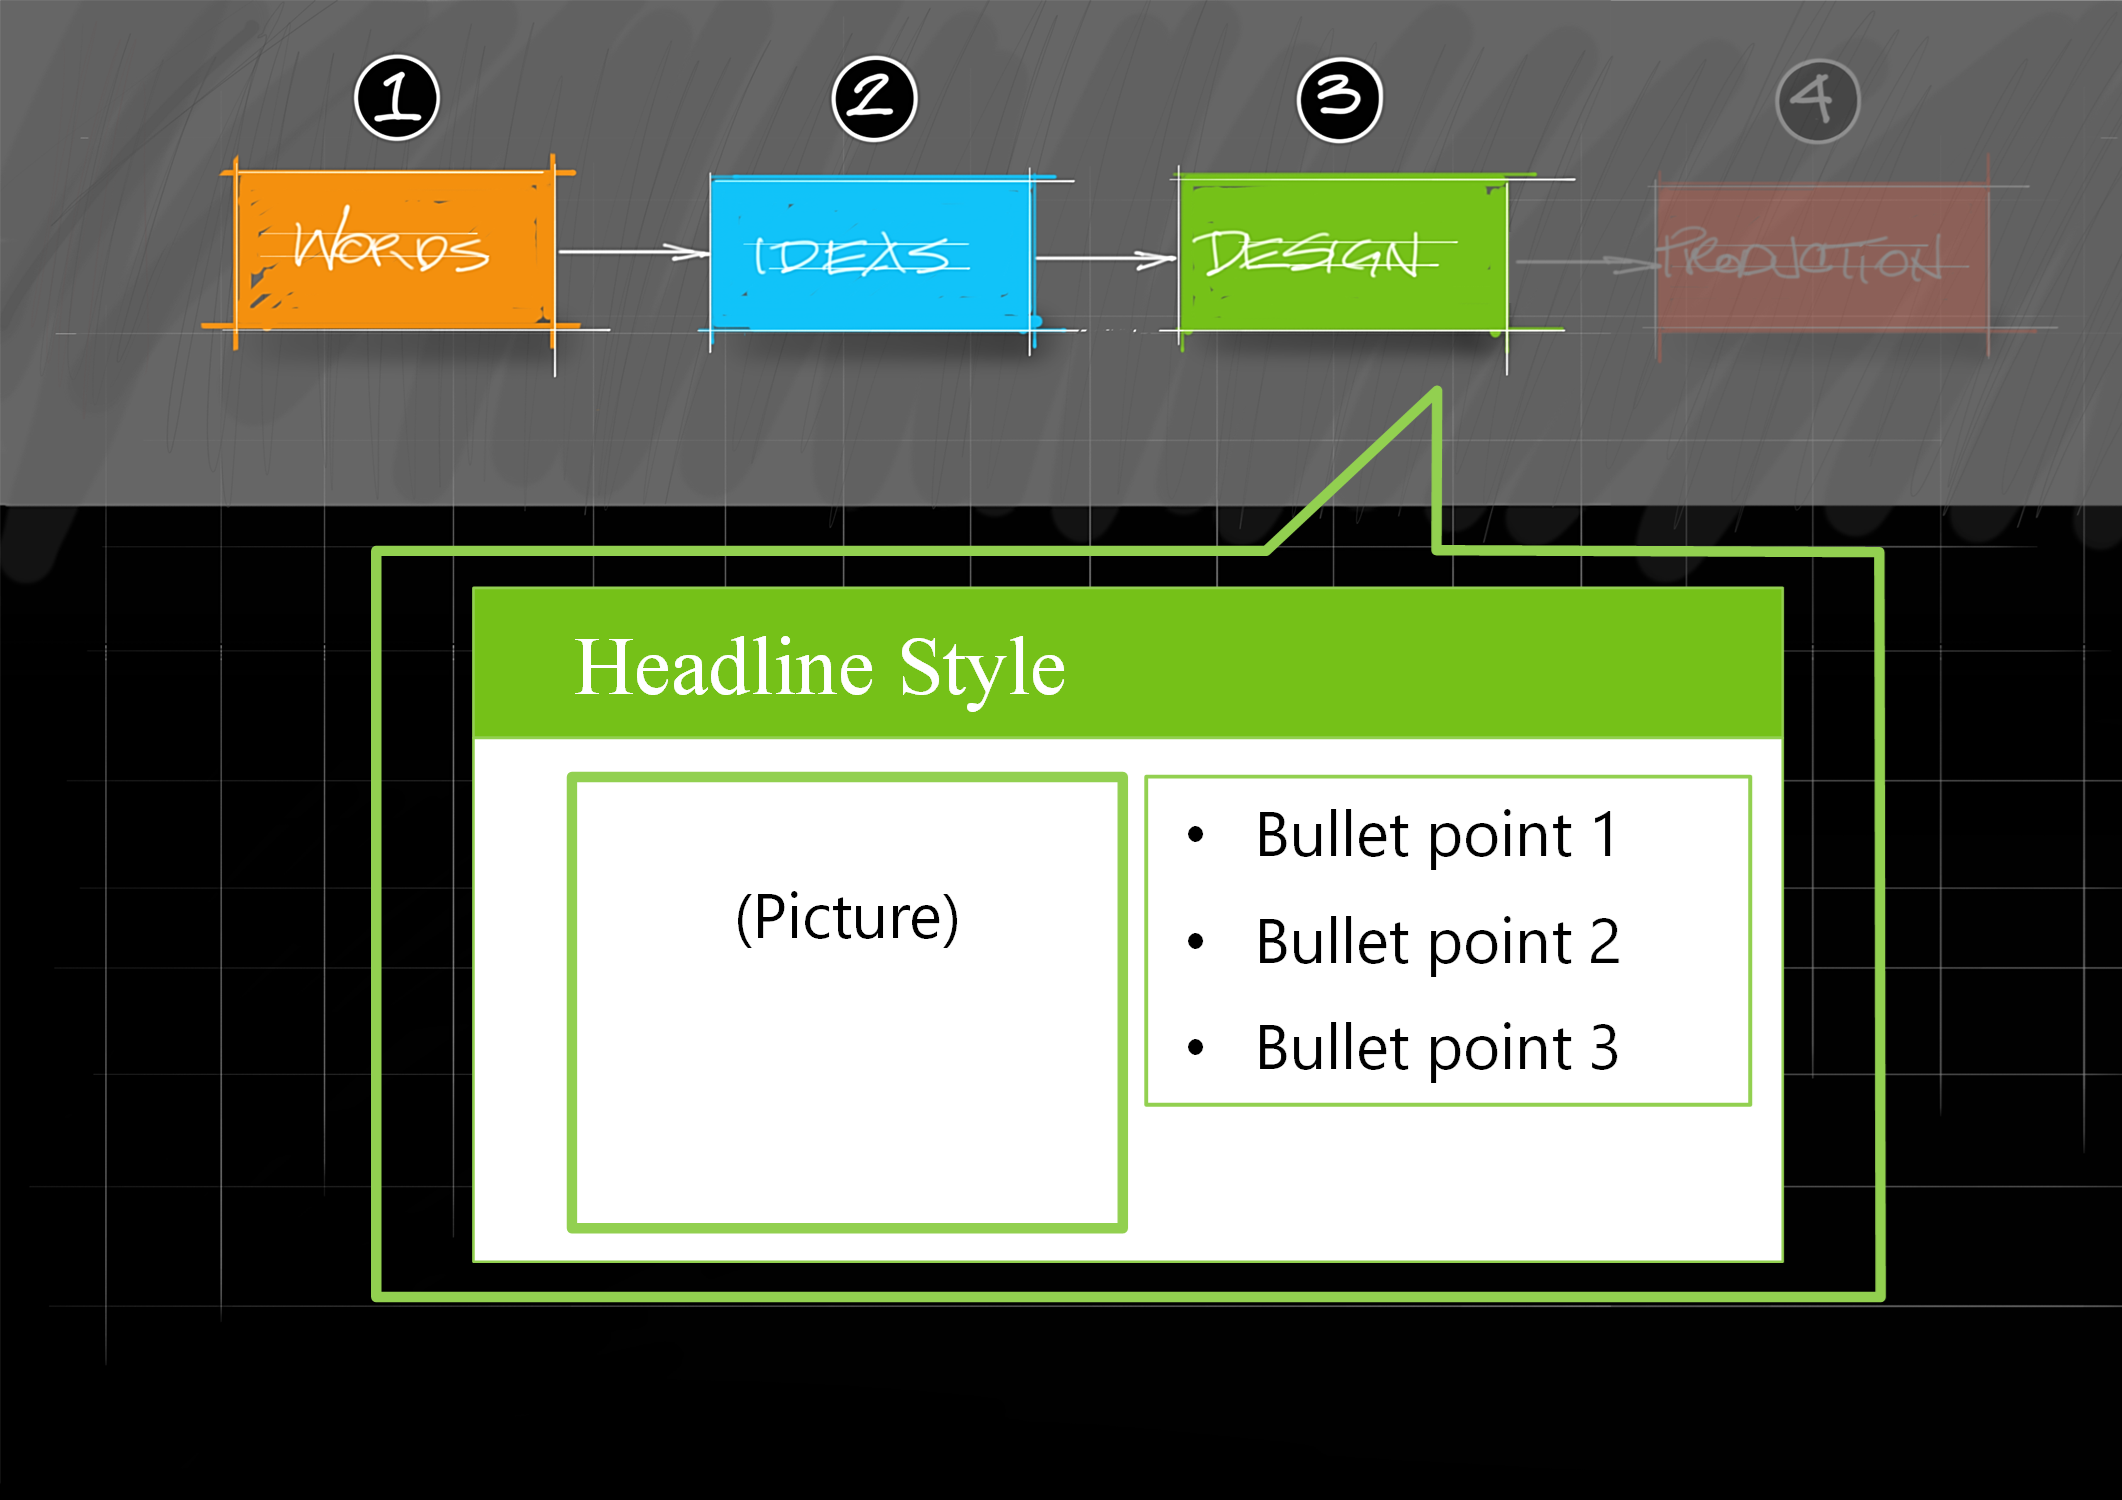
3) Design or adapt a format to fit your exhibit types;
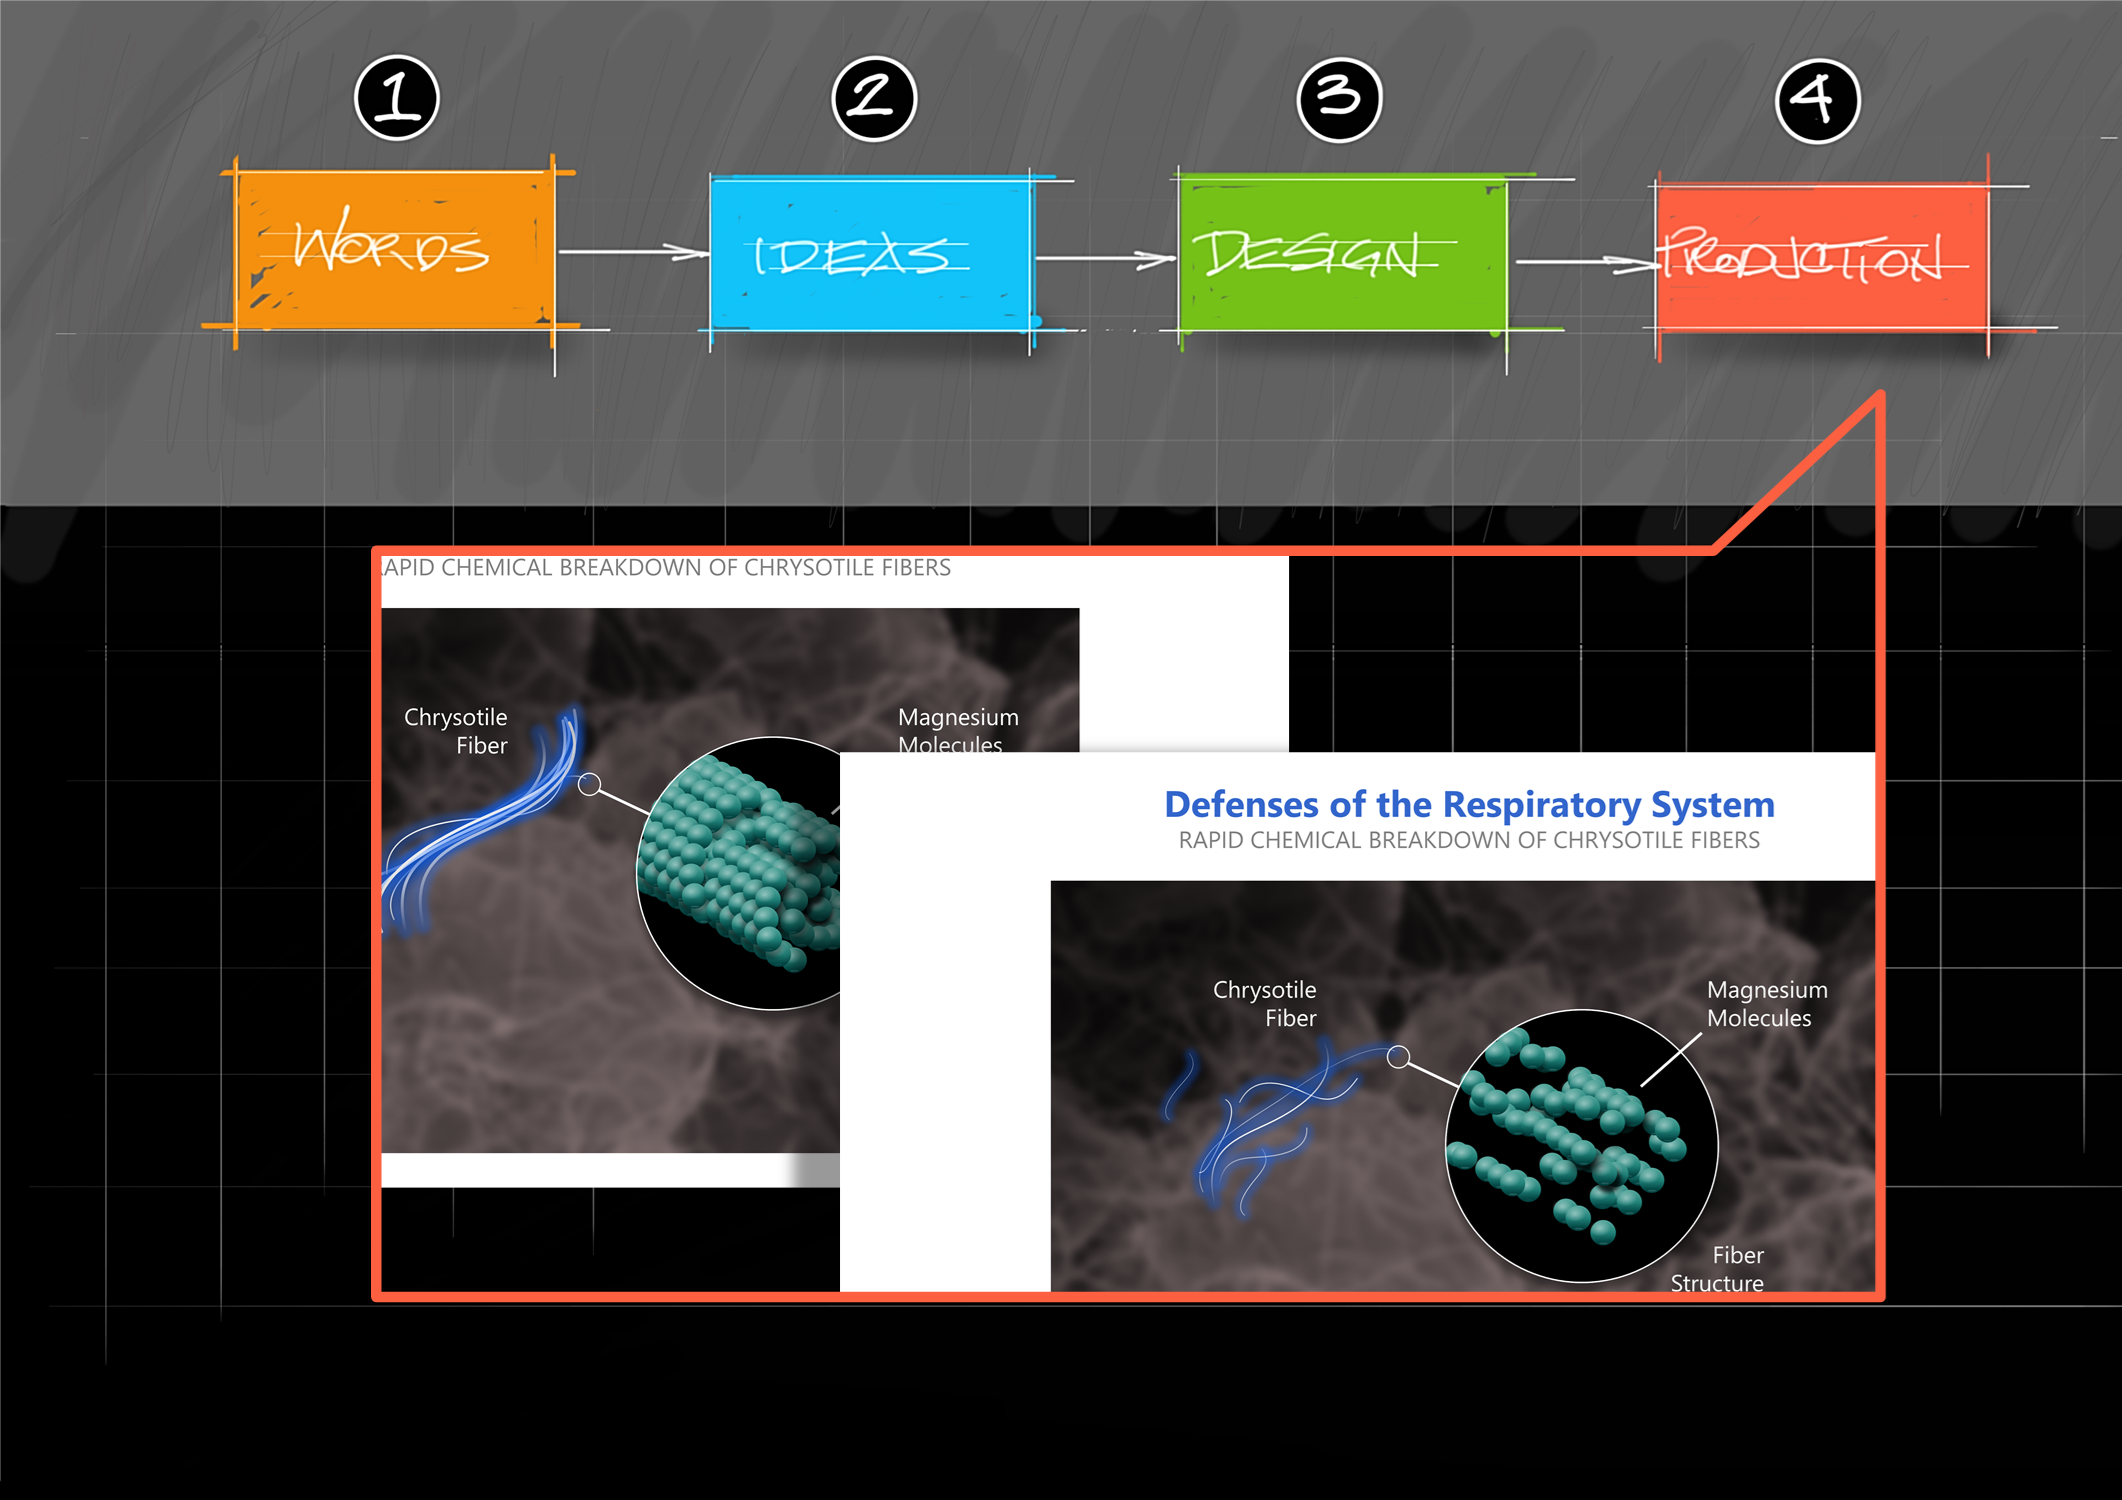
4) Produce the graphs, illustrations and graphics and create a finished deck.
Whether you work with an outside consultant, in-firm resources, or do it yourself, the resulting visualization of your case will benefit from having gone through this process.

Why are graphics important to successful trial lawyers?
Ever wonder why graphics are so important in the courtroom? Science offers insights into how visual presentations affect jurors’ brains.
Pictures amplify and clarify by selective inclusion, order of presentation, use of emphasis, and by use of favorable or negative depictions — all these things work together to present an organized, coherent experience for your audience.
Our team specializes in developing graphics that capture complex issues and present them in a simple, clear way. Contact us to learn more about how we can help.
Years ago, a lawyer I knew asked me to produce some illustrations to help his expert witness explain a case of brain injury to a jury. I drew perspective views juxtaposed with CT scans to show a void in the cerebral cortex left by the trauma. My client won a trial verdict, and at the victory dinner, he cited the graphics as being key to the award. Even though these pictures were only seen by a few people, they helped produce a significant result. All this was a revelation to me — I had never even heard of “demonstrative evidence.” A few years later, I joined FTI to make it my life’s work.
To the proverbial hammer, everything looks like a nail. So, of course I think graphics are important... But, graphics are of critical importance to trial lawyers simply because they are critical to your audience: the judges, arbitrators, and jurors who will decide your case. They make decisions based on their understanding of the facts, and as we explore here, that understanding is shaped more by what they see than by what they read or hear.
The power of graphics
The power of pictures is not a little thing — it is a several hundred percent improvement in recall, short and long term, as shown by research published in the late 1960s by Dale, et al. Many studies, including by Houts, et al. in 2006, show a similar-scale improvement in comprehension using pictures as compared with words alone.
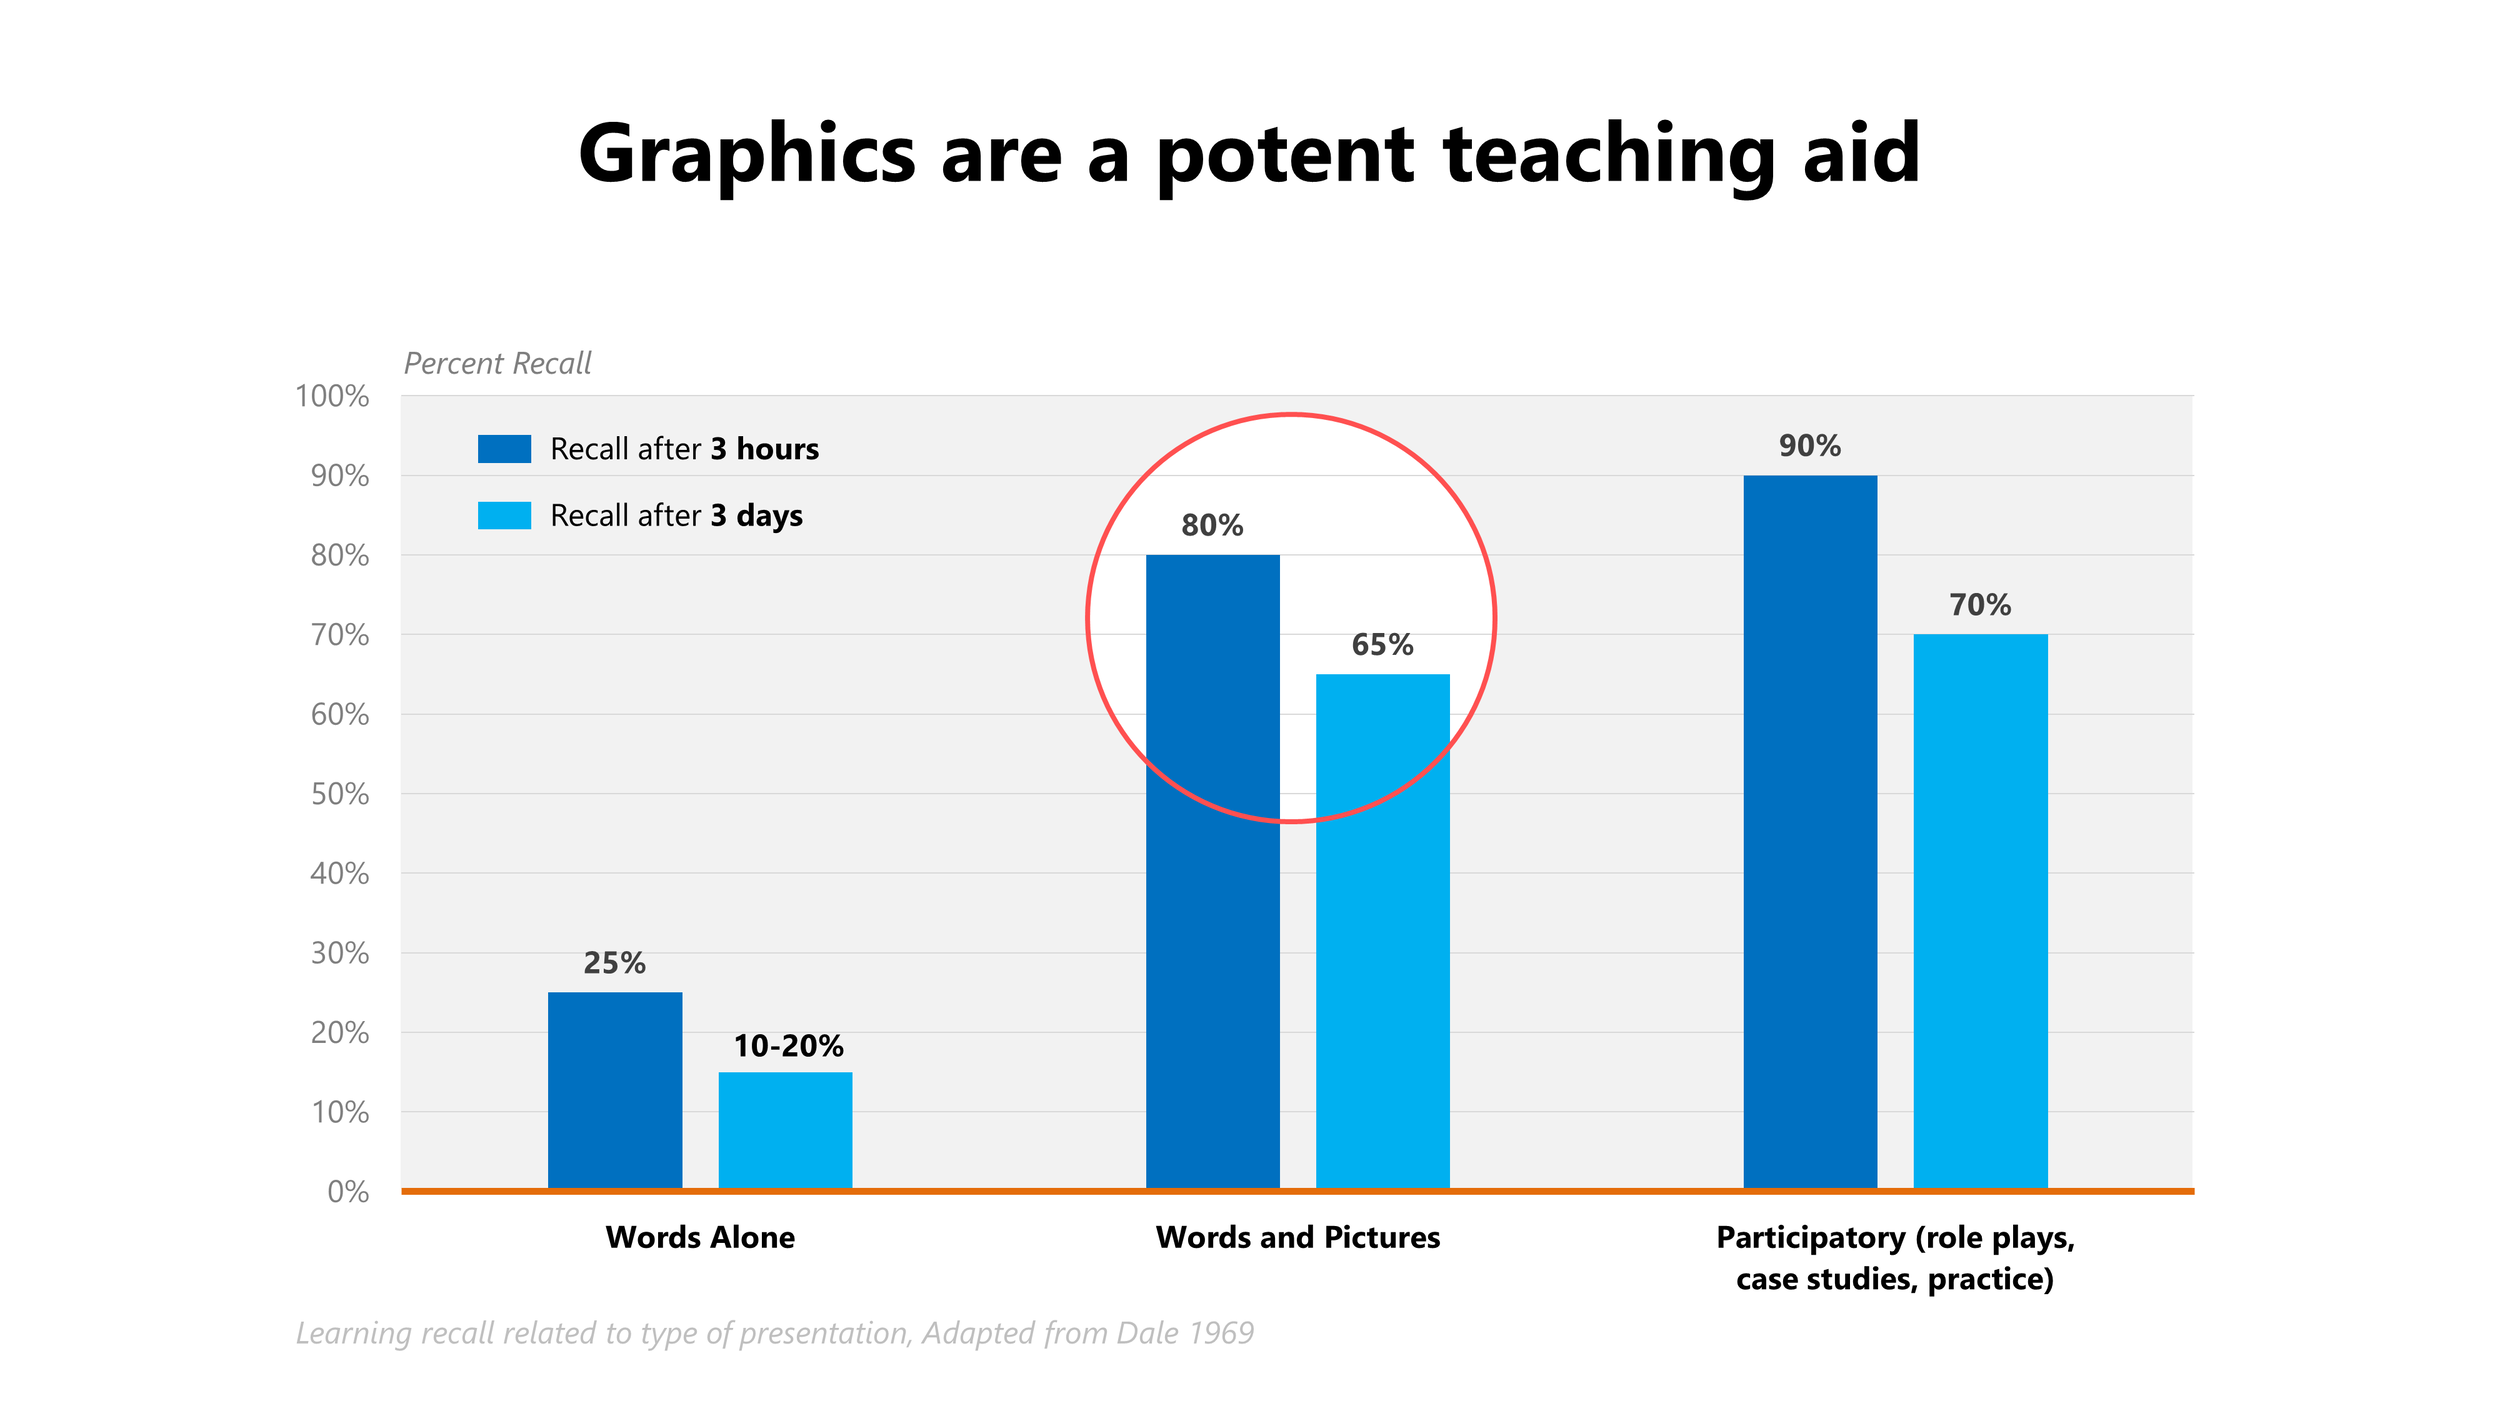
In the late 1960s, Dale, et al. showed 300%+ increases in short and long term retention with words and pictures over words alone.
In the late 1990s, Grady et al. probed the neurophysiology of this phenomenon: “A striking characteristic of human memory is that pictures are remembered better than words. We examined the neural correlates of memory for pictures and words in the context of episodic memory encoding to determine material-specific differences in brain activity patterns. To do this, we used positron emission tomography to map the brain regions active during encoding of words and pictures of objects.”
They found that the subjects seeing pictures showed large distinct regions of brain activity, separate from and in addition to regions activated by verbal stimuli. That is, clinical proof of the years-old two-track (visual and verbal) theory of learning, and an answer to why pictures have power: they occupy more of your audience’s brains.
Graphics may have another effect that is of even more profound benefit to trial lawyers: in a small group study we did as an adjunct to a case focus group, we saw a multifold increase in the reported believability of images that include pictorial content over those with verbal content alone.
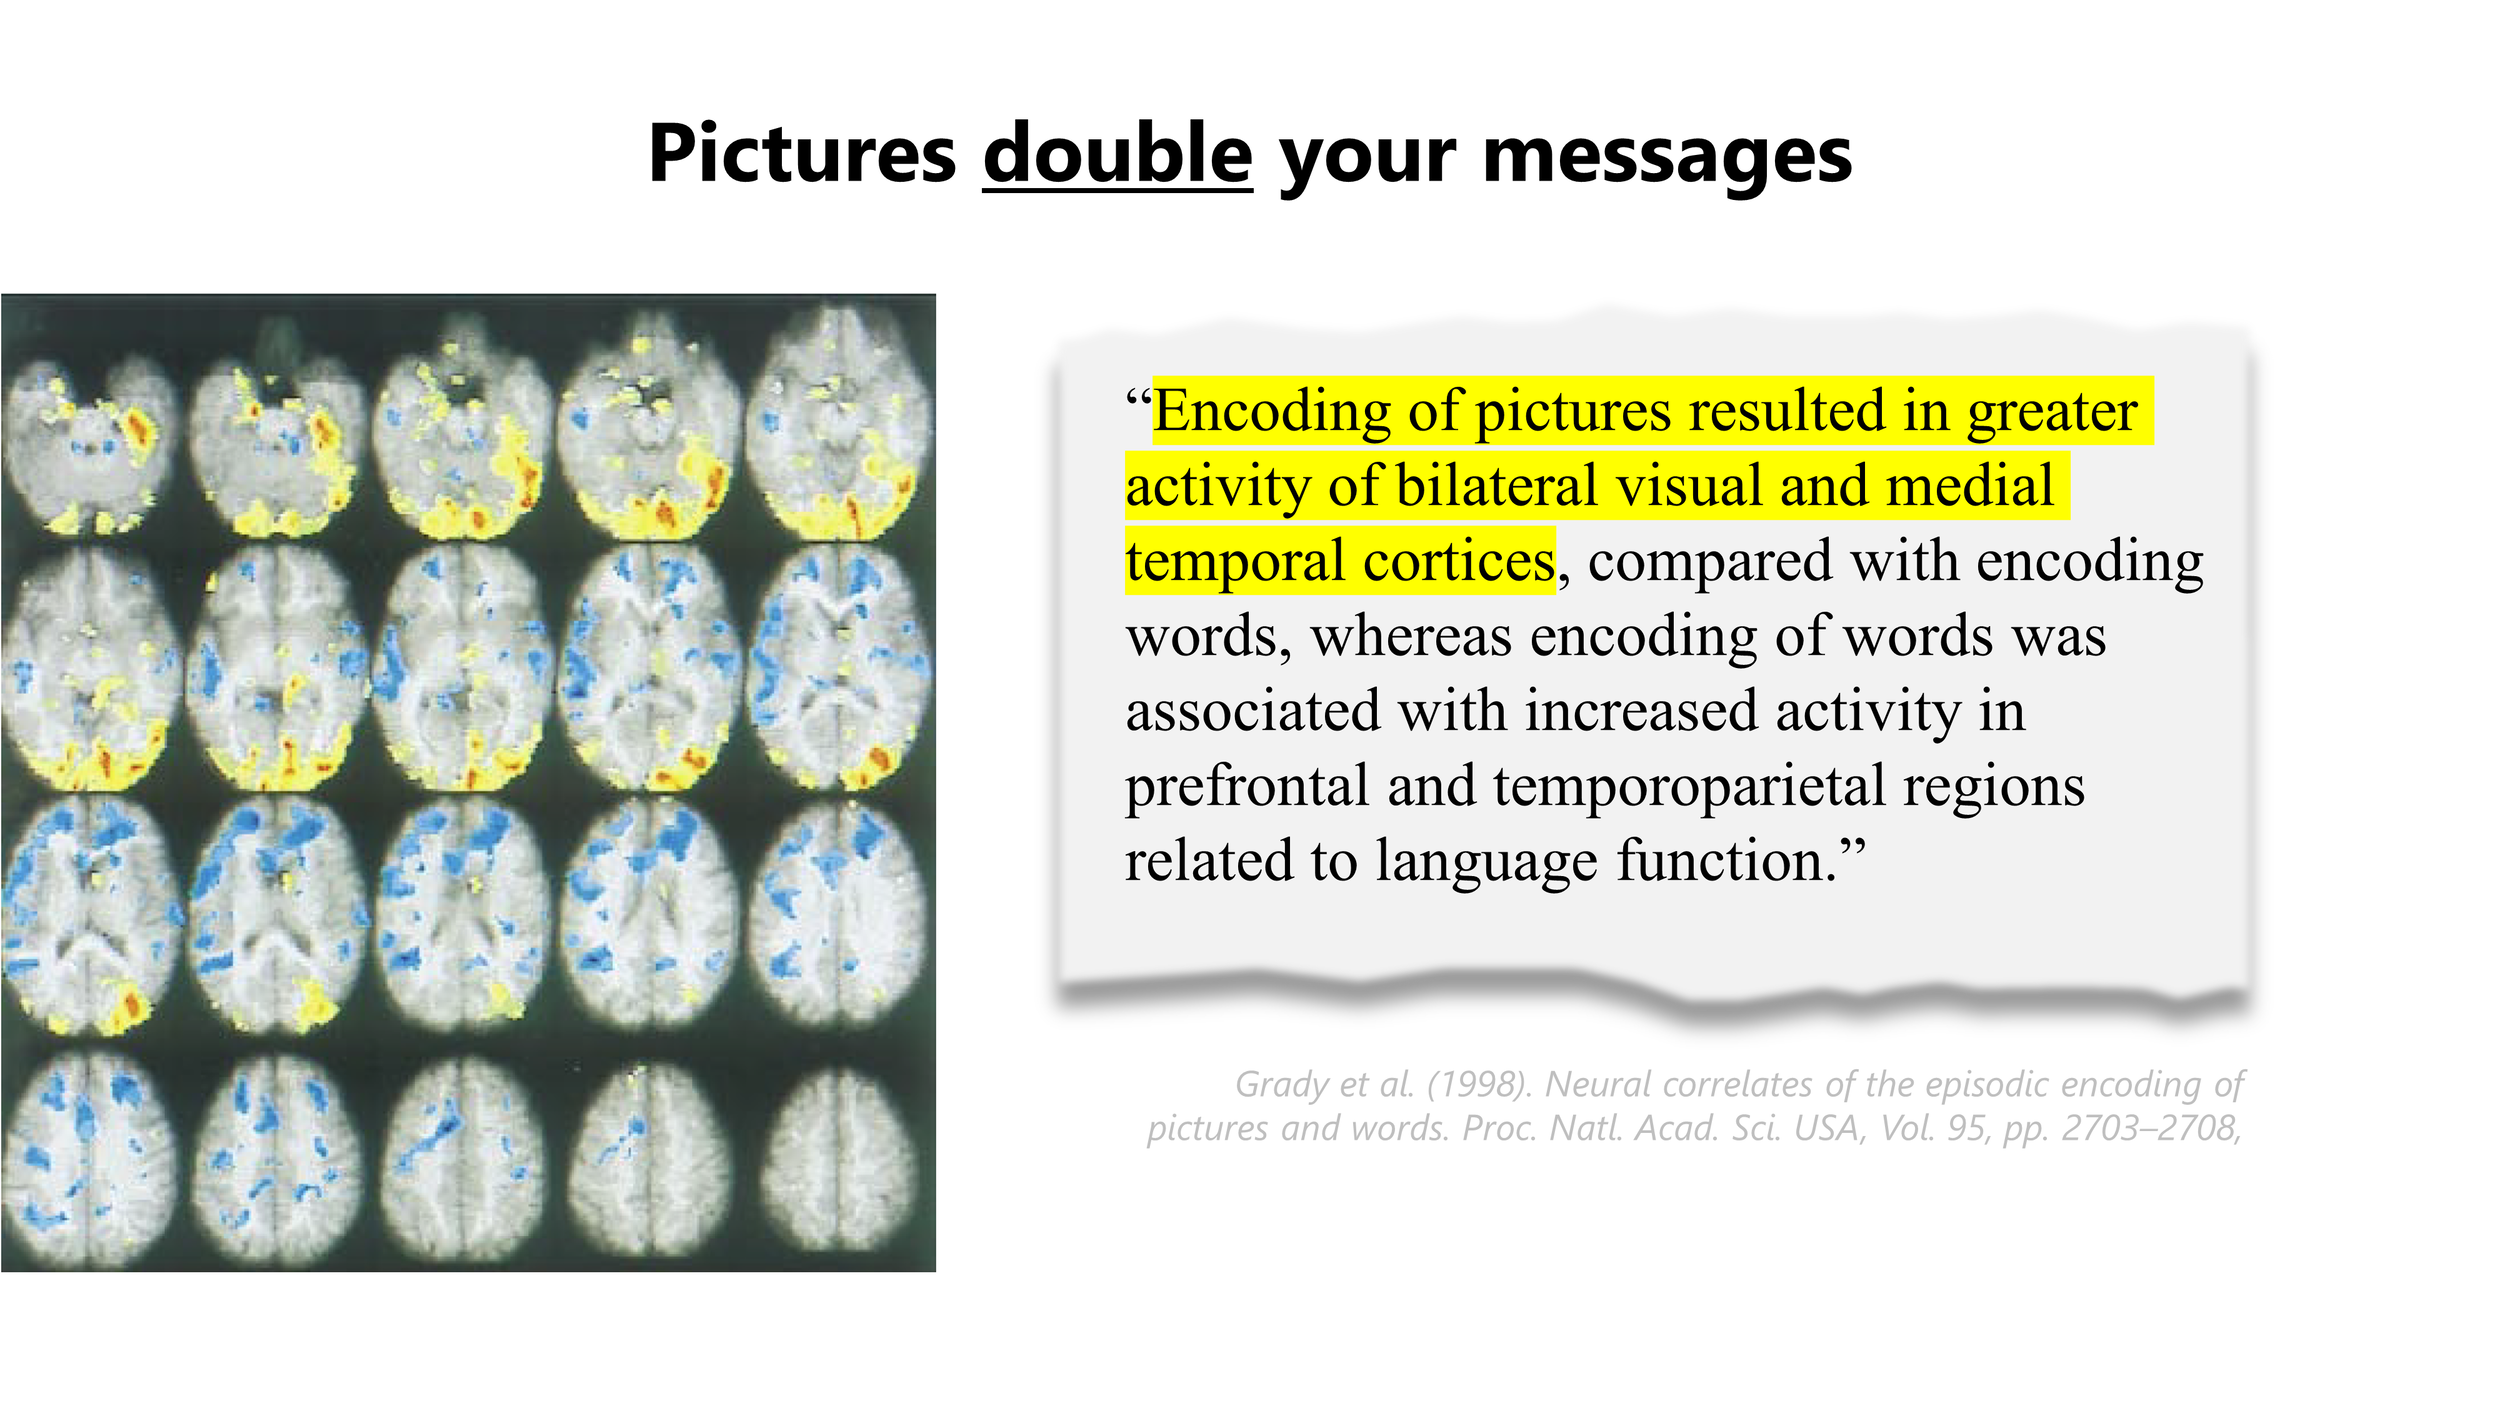
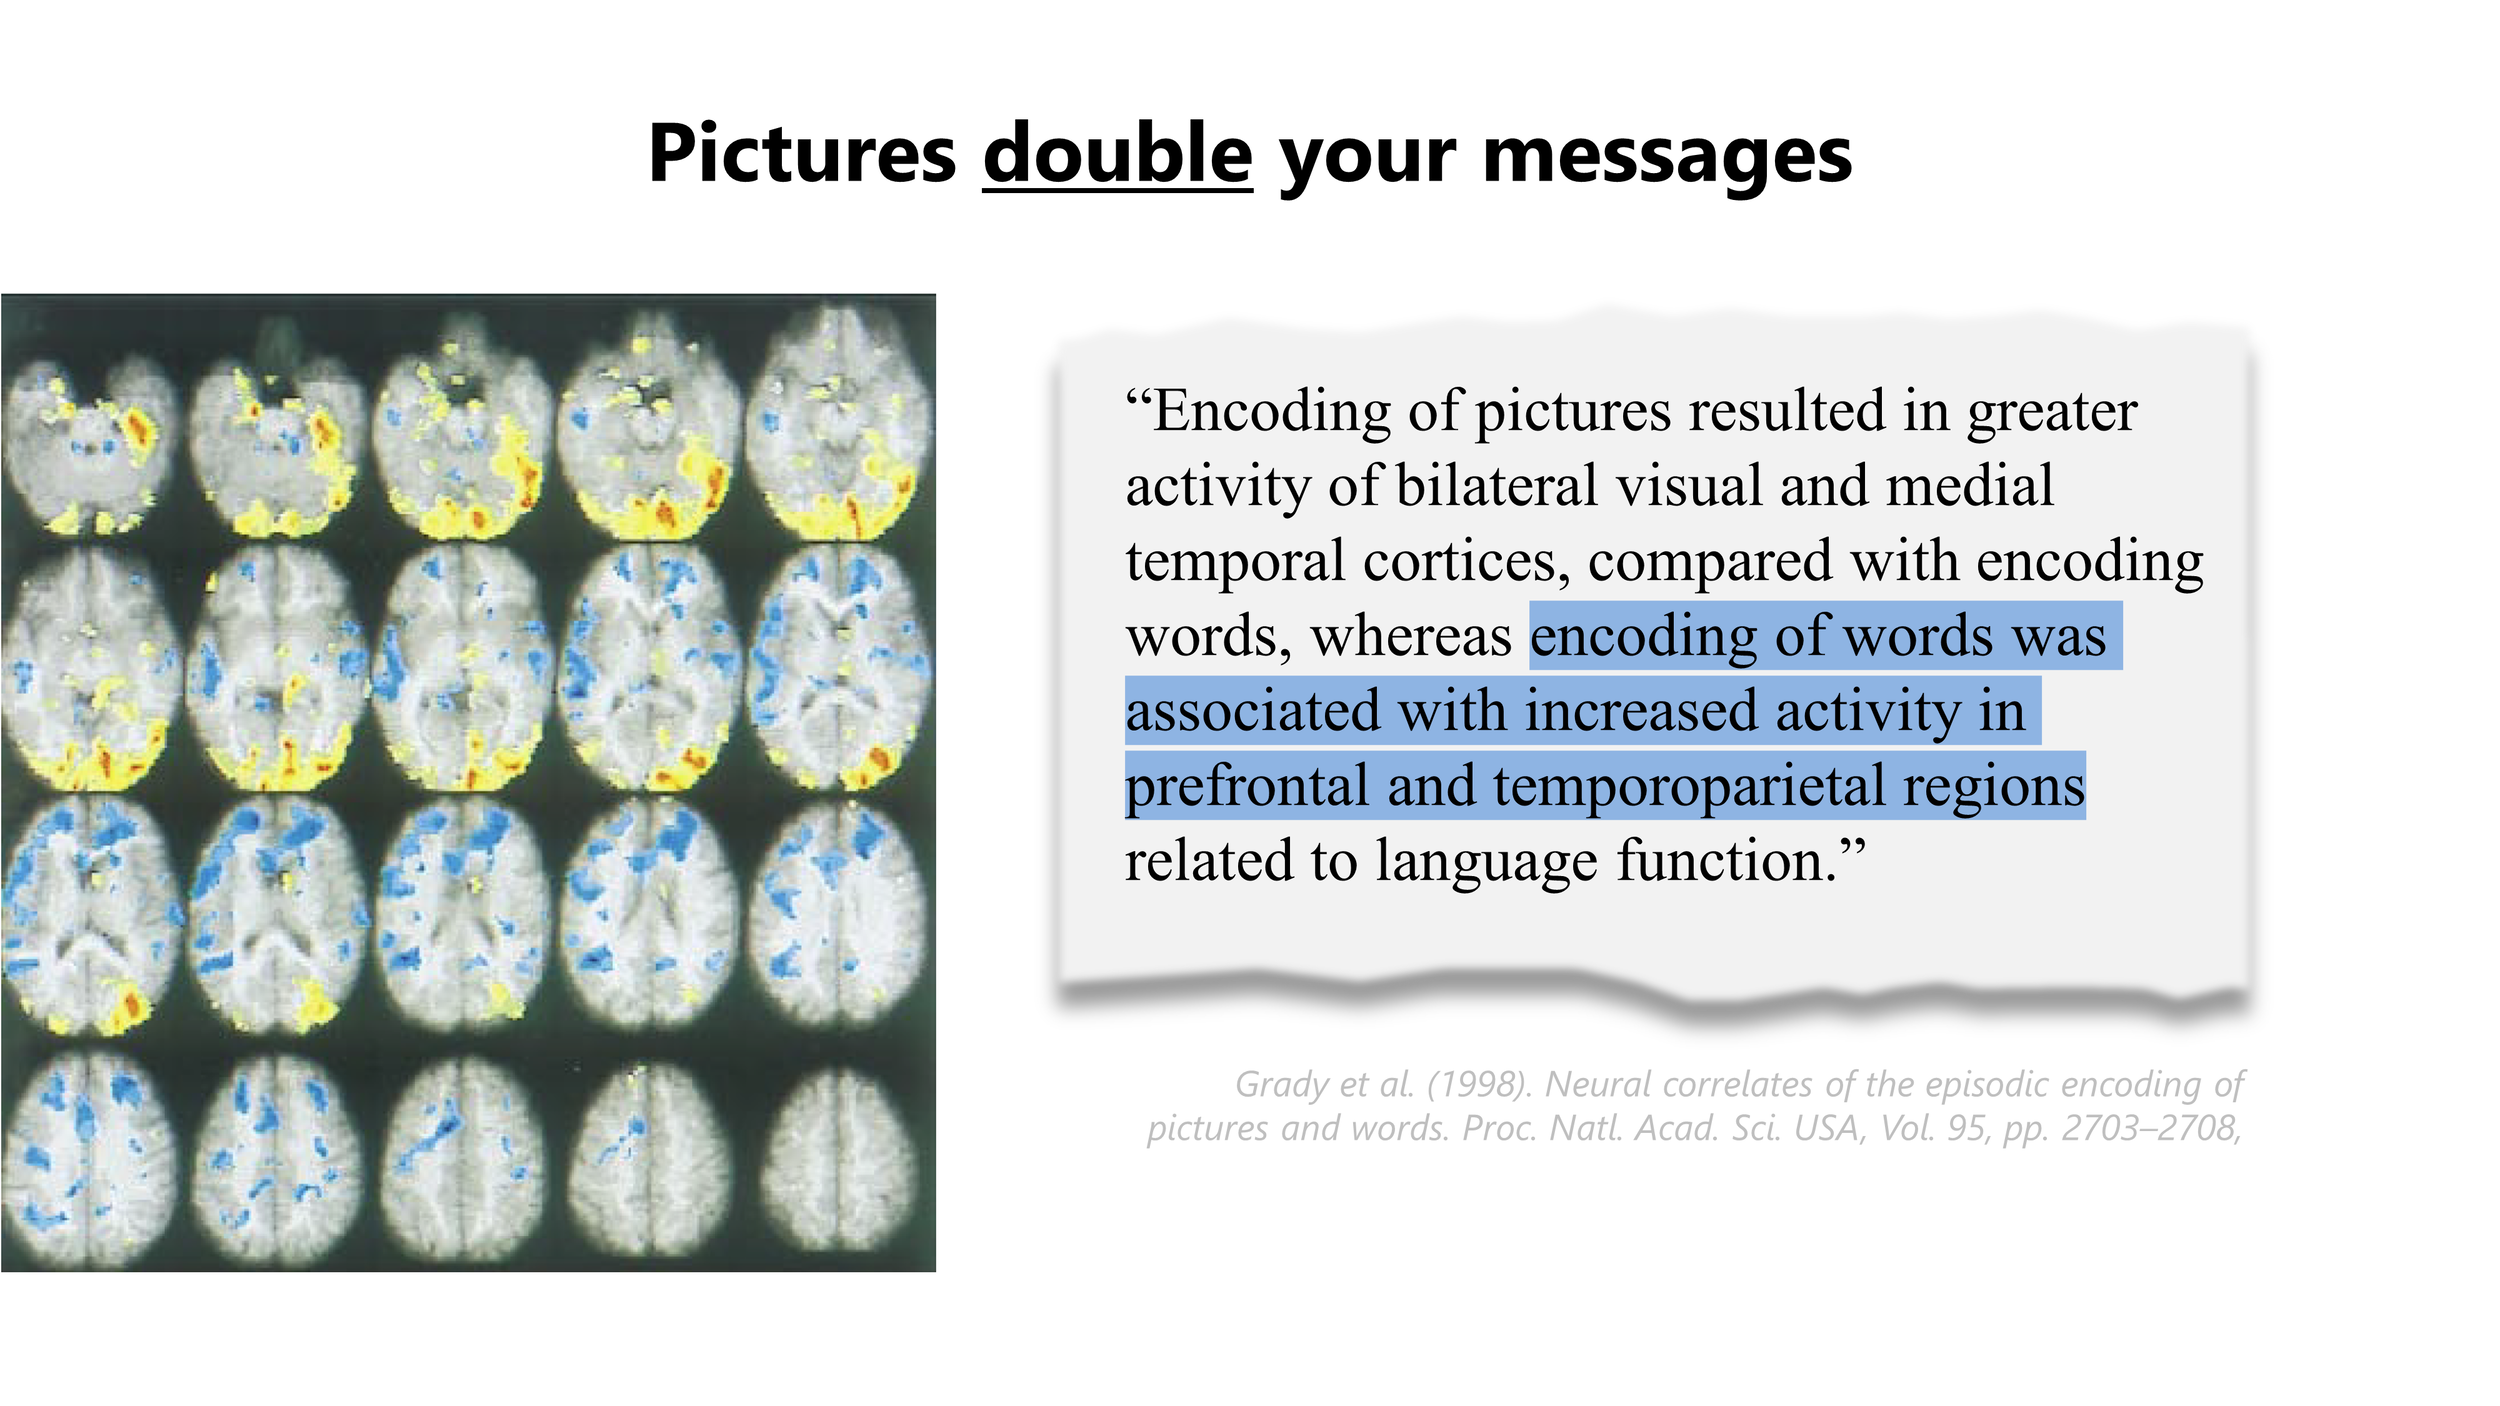
In the late 1990s, Grady et al used PET scanning to capture dramatic images that proved adding pictures to verbal narrative significantly increased the area of brain activity. In fact, viewing pictures involved additional, separate regions of the brain.
I don’t suggest that trial presentations should be festooned with meaningless pictures, far from it. Your graphics should work hard for you, explaining, proving, and helping to carry the cognitive load of case facts and evidence.
Shouldering the cognitive load
The adage may be “explaining is losing,” but in my experience the better motto is “be the teacher.” I’ve never heard of jurors saying “thanks for not explaining this,” but many times I’ve heard the opposite. Jurors hate to be confused, love to understand and love to feel smart. This presents a huge opportunity for the trial lawyer, and good graphics help to exploit it.
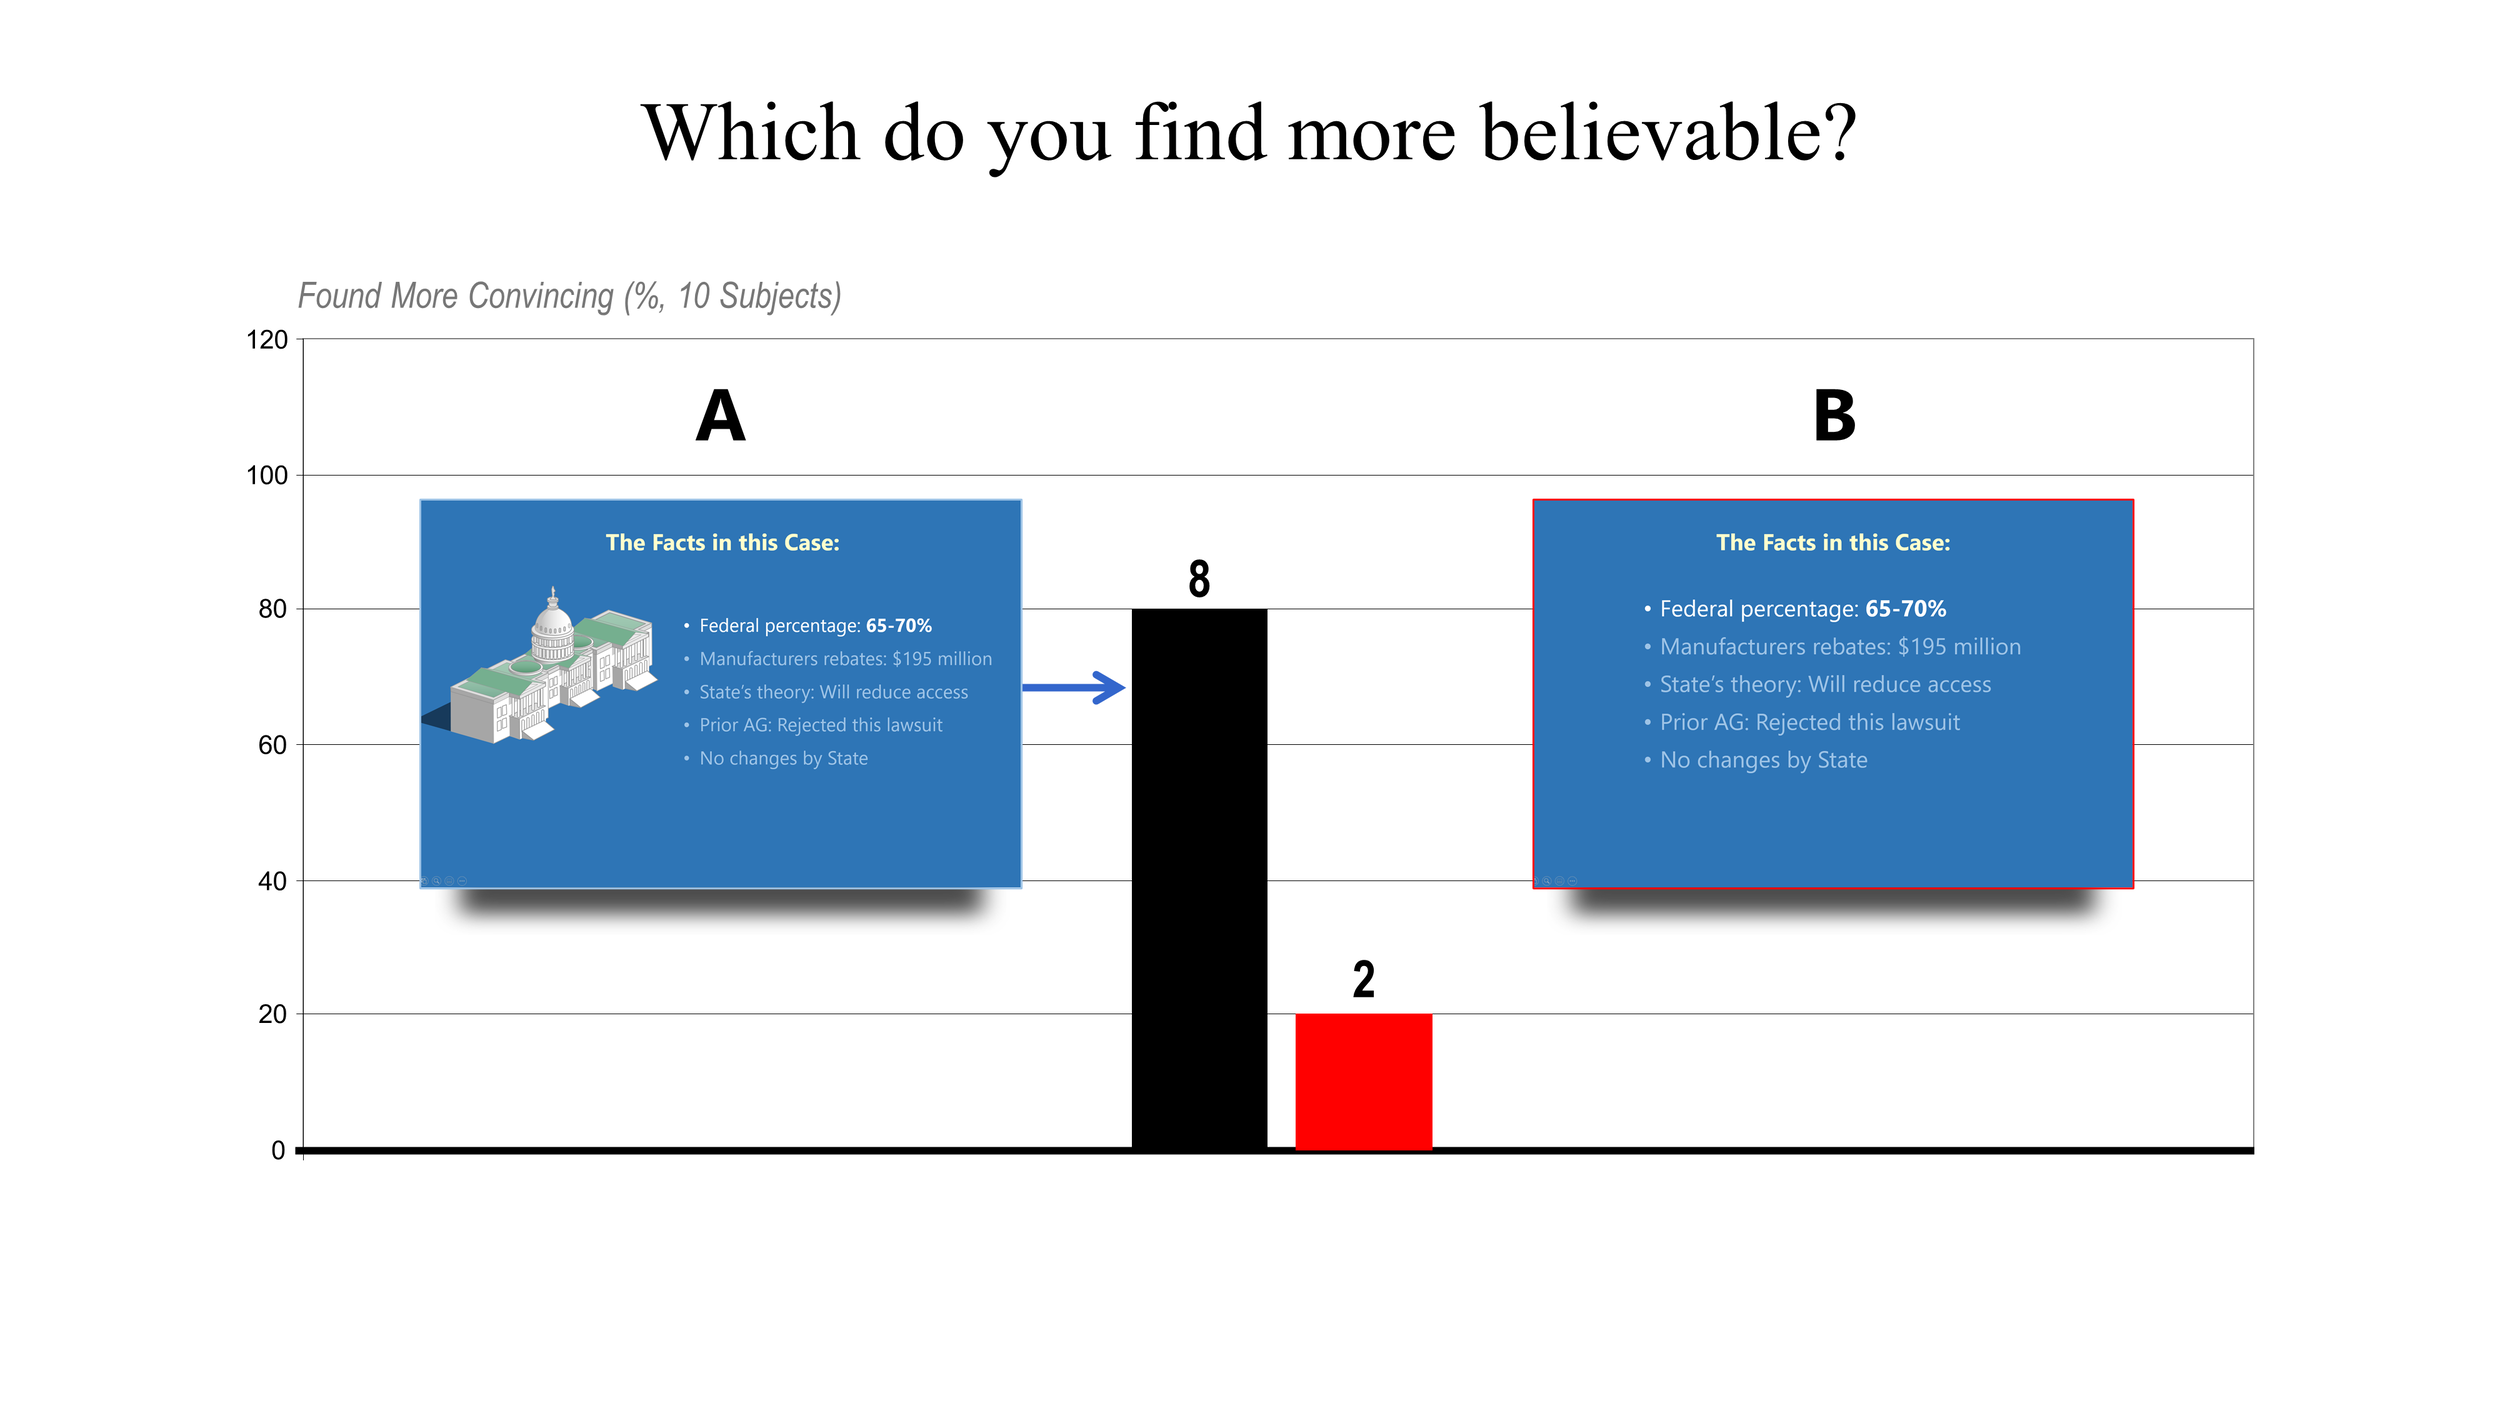
In multiple small group tests, we found that mock jurors consistently and overwhelmingly selected images that included pictures as more believable than those without. Even when challenged in individual interviews, jurors confirmed this strong bias.
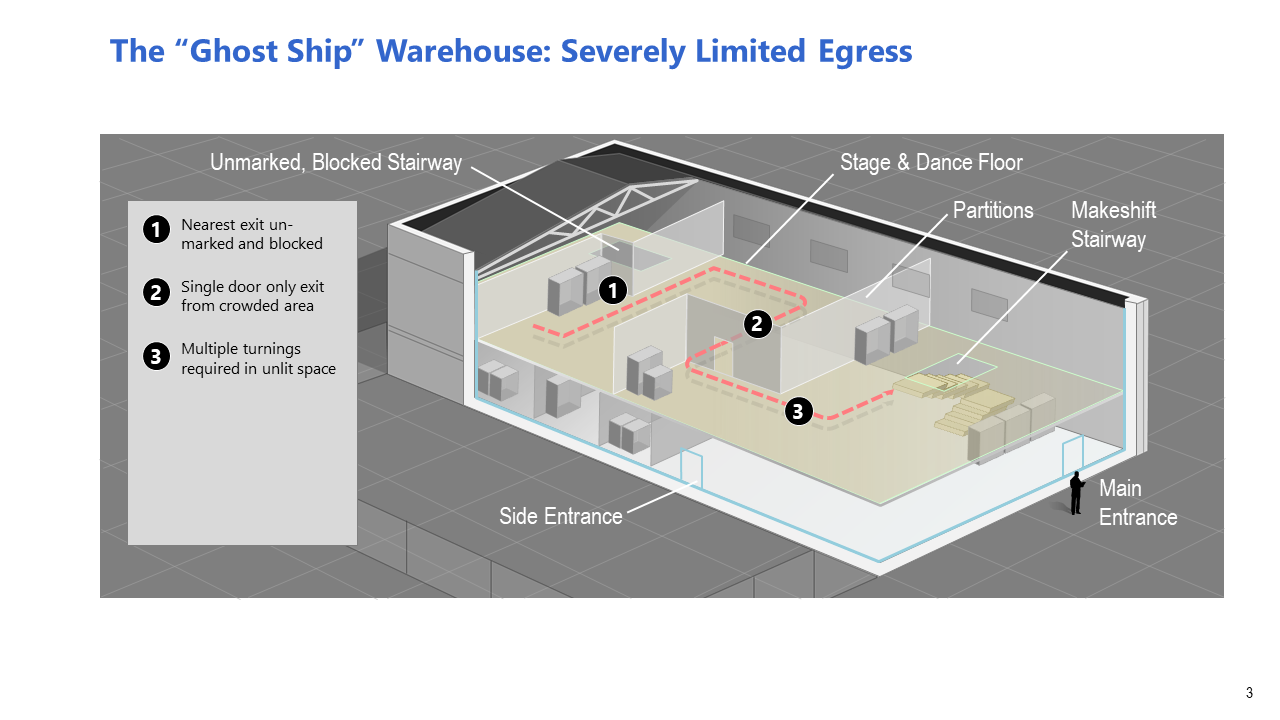
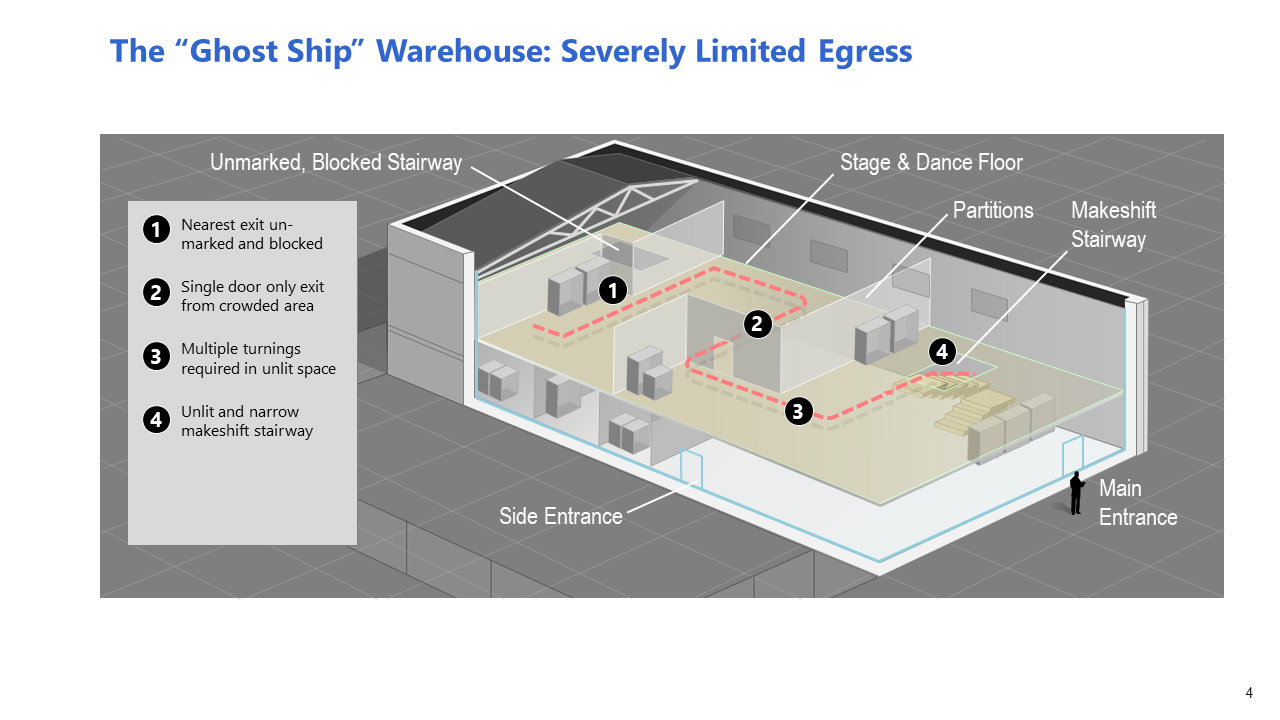
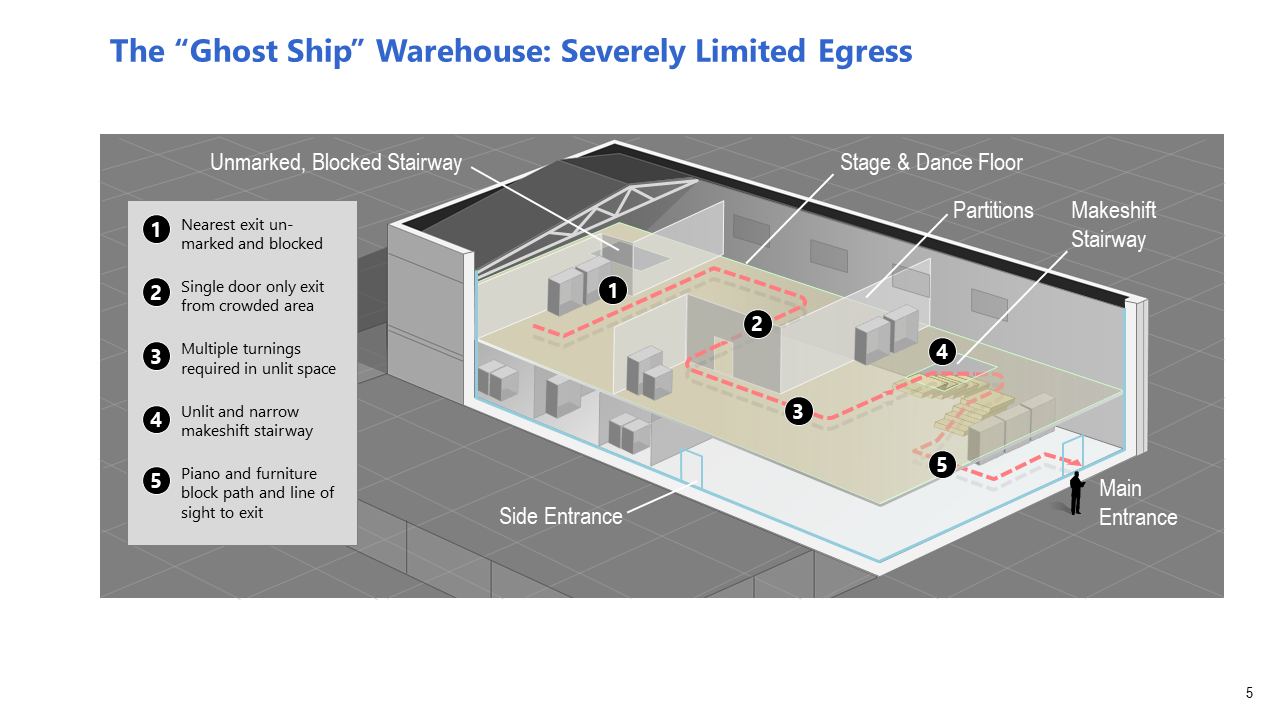
Accordingly, the lack of a good visual explanation, in many cases, leads directly to judge or jury confusion and a negative outcome: an unfavorable settlement or bad trial verdict. In one particularly difficult case, the team struggled to gain an understanding — and good graphics to explain — the disputed cutting-edge technology. One defendant settled after a focus group showed that jurors just didn’t get it. The other defendant stayed in the game, working with us and the experts to develop a compact verbal and visual explanation of the technology at issue. They went to trial with a jury and won.
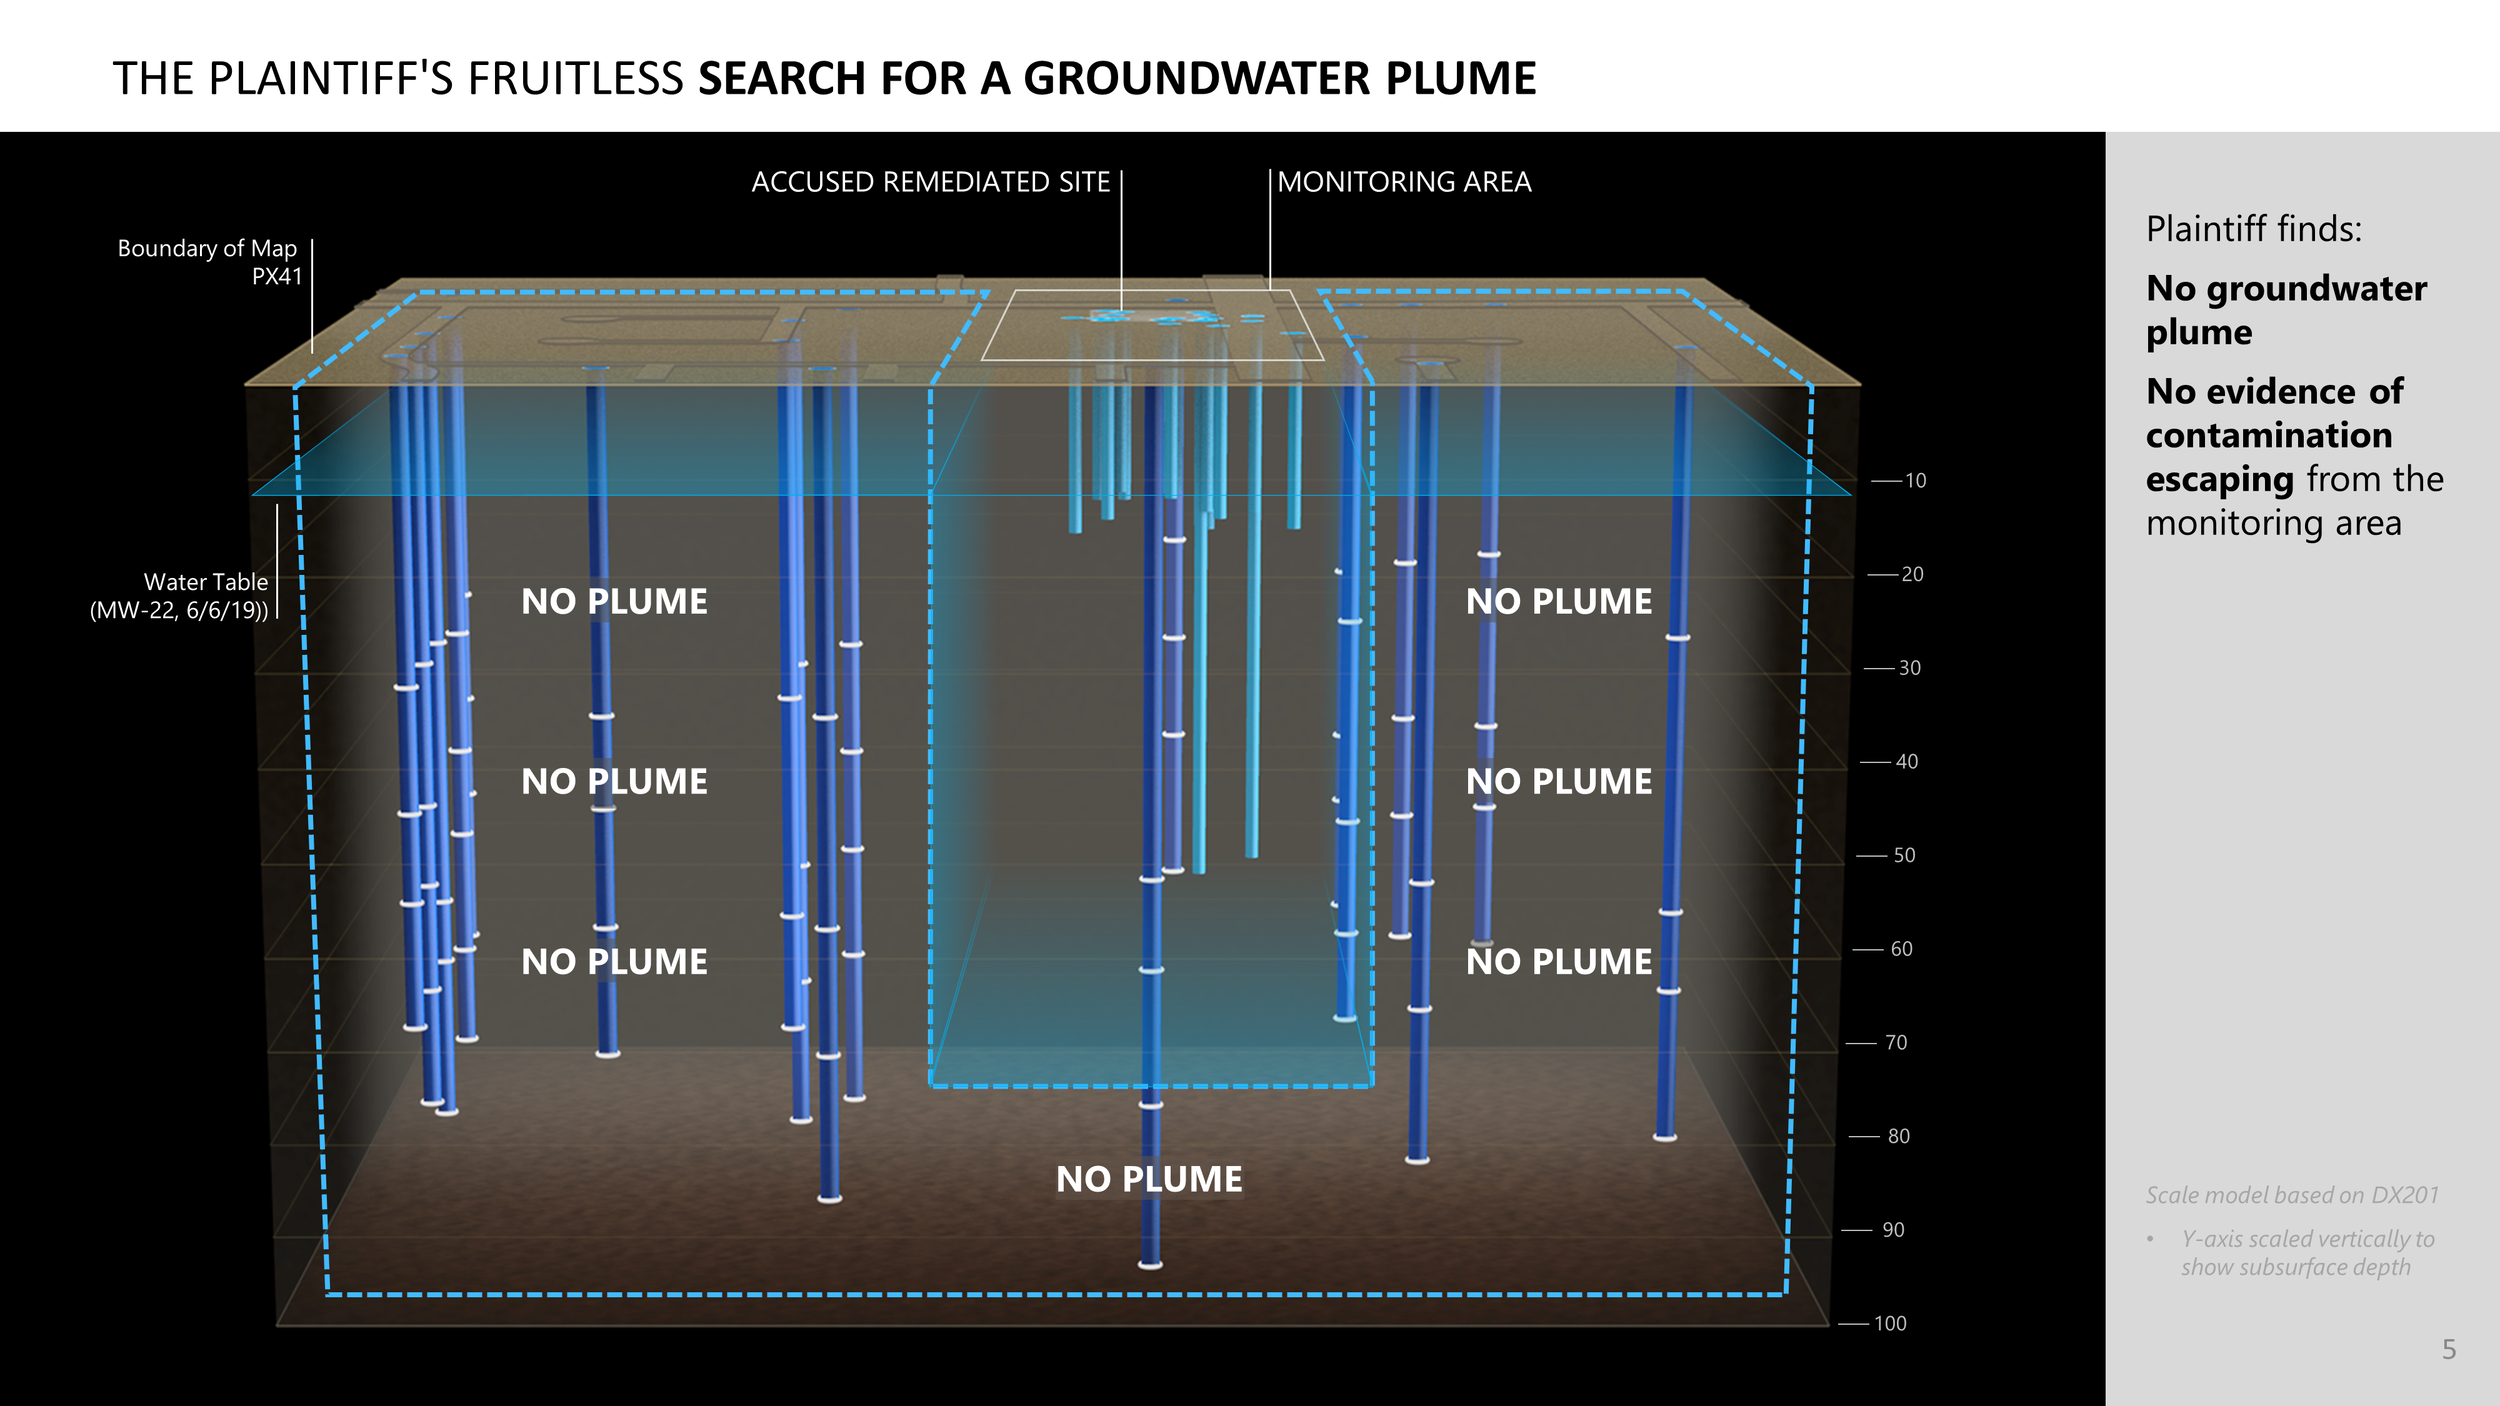
With this 3D animation, jurors receive an orientation to the basic hydrogeology of an accused site. At the same time, they build the visual and verbal vocabulary they need to understand and agree with the defense case.
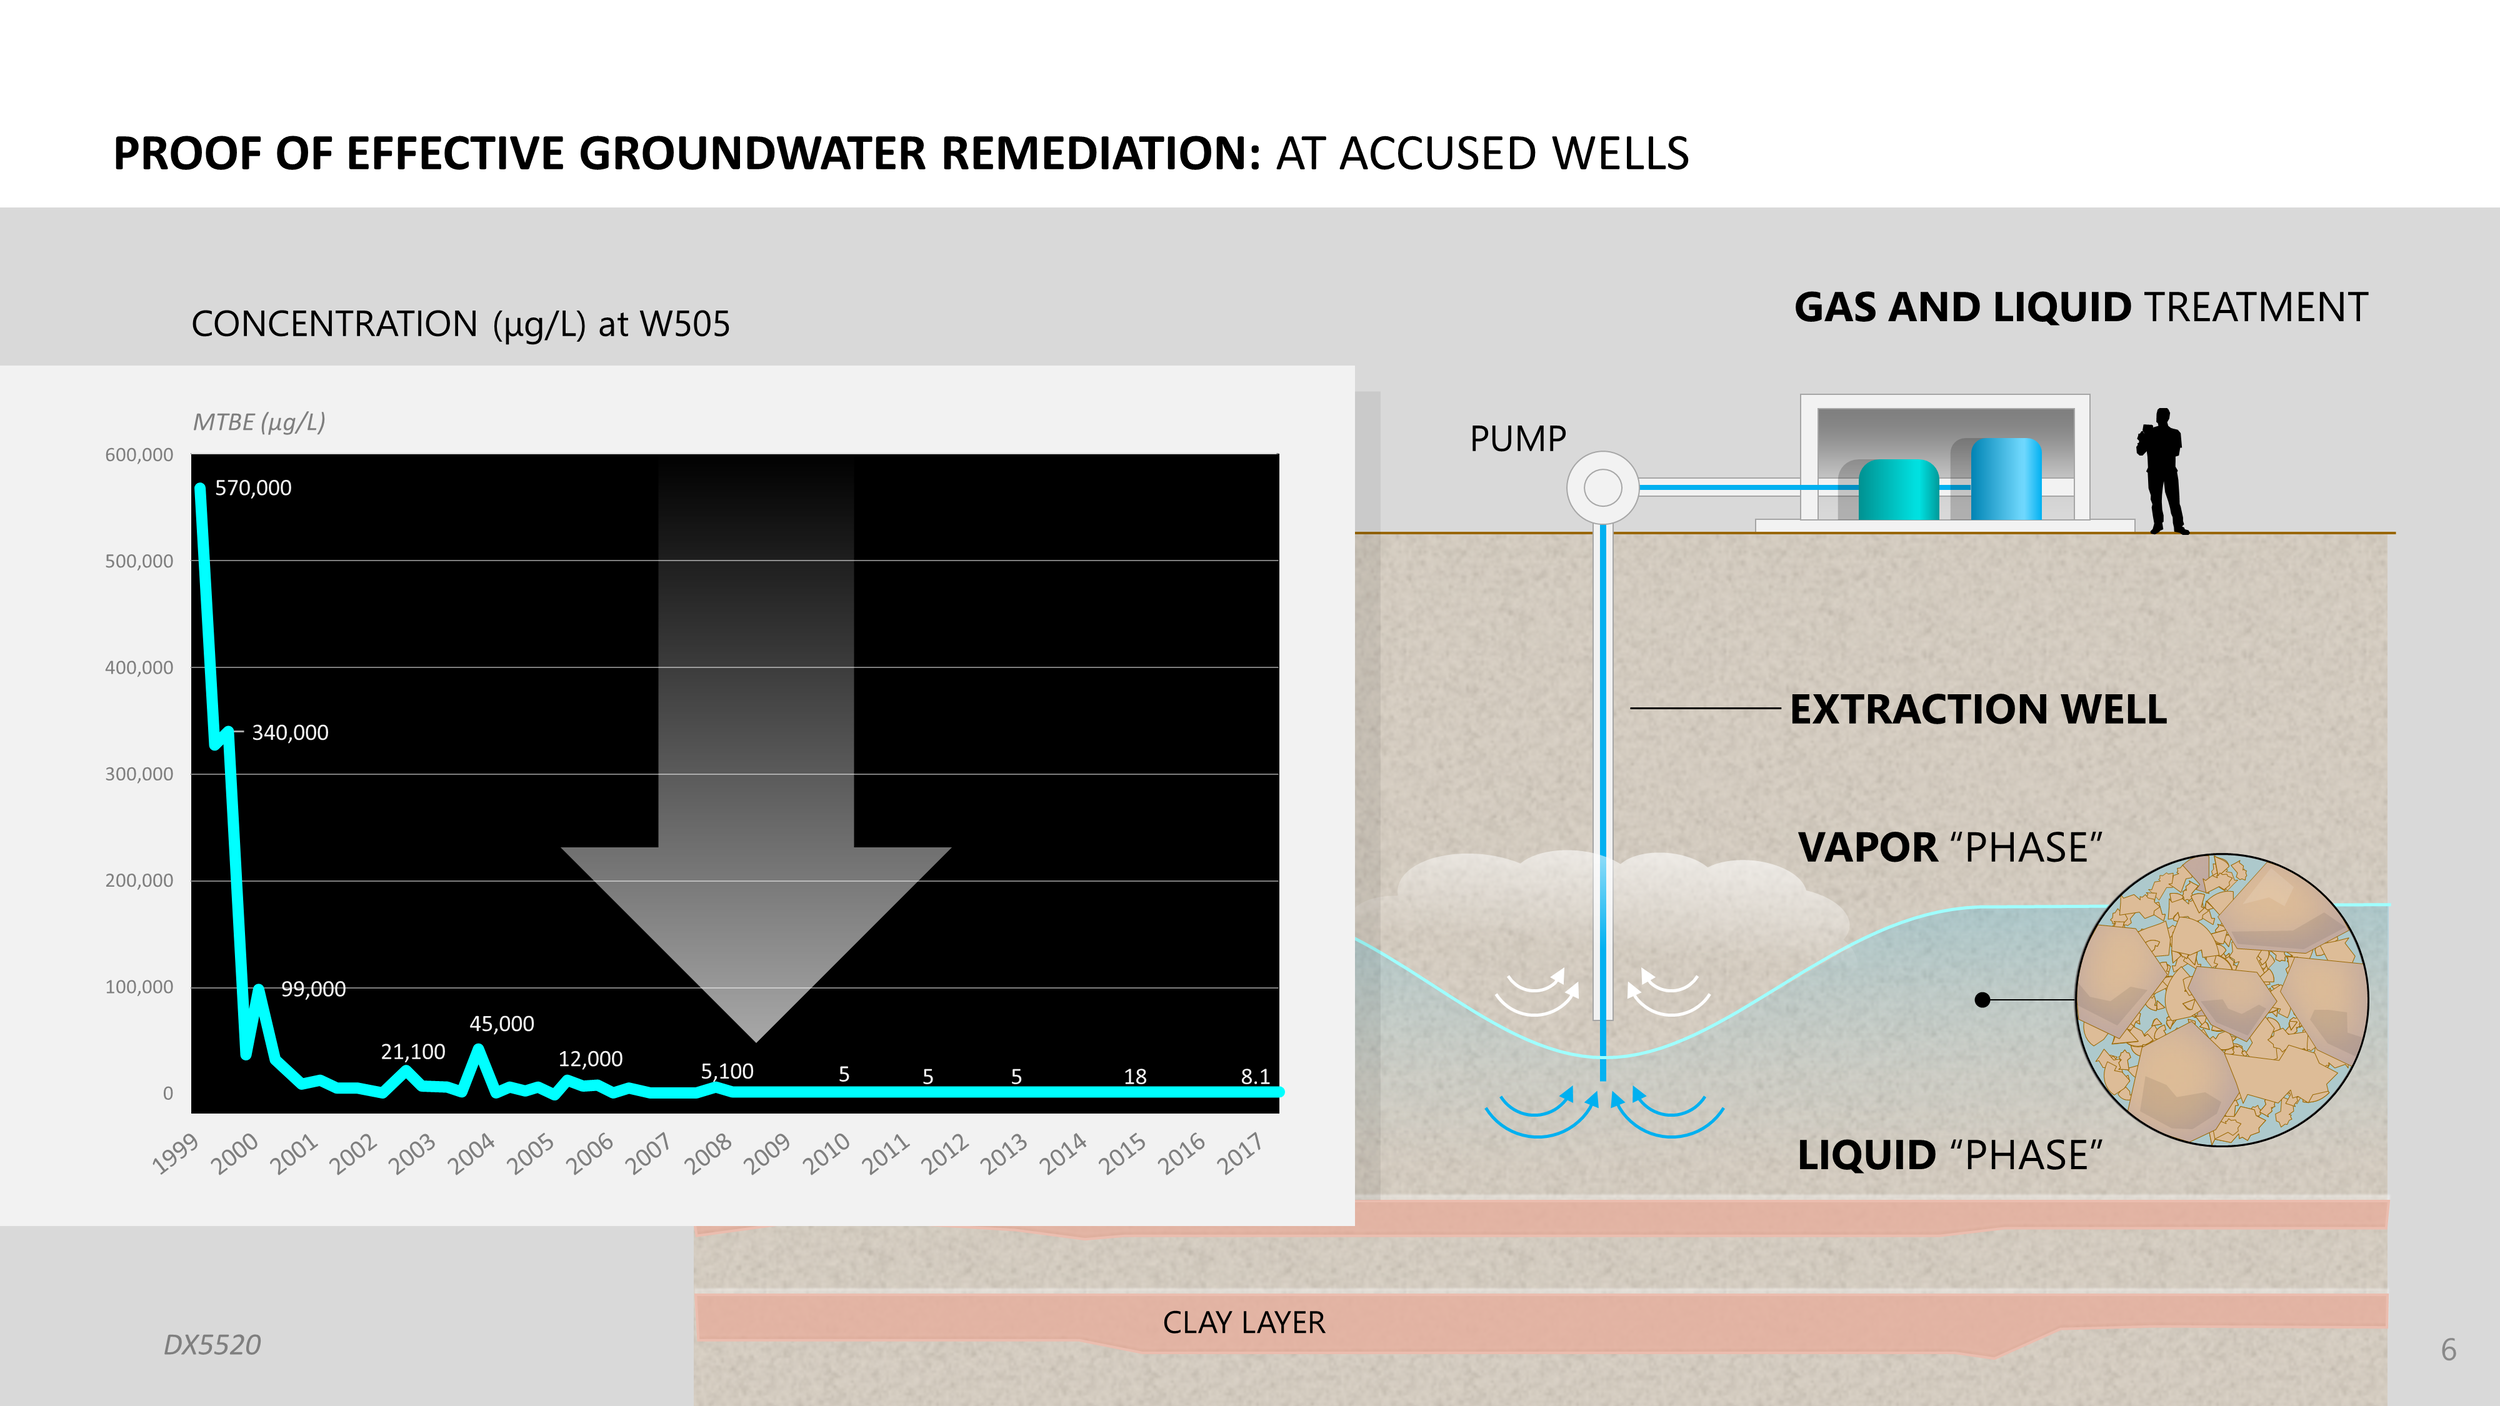
Similarly, and in the same case, this 2D animation explains how remediation works, and shows the proof we have that it is working at the accused site.
Einstein is believed to have said, “If you can’t explain it to a six-year-old, you don’t understand it yourself.” I don’t know if that’s accurate, but I know it’s true. Lawyer and artist need to attain (sometimes by dint of repeated effort) a robust understanding of the issues in order to translate them into a visual and verbal language a layperson can understand and act on. In other words, you and your graphic designer need to understand it deeply to be able to present it simply.
Embodying your case
Good graphics are not an accessory to your case, good graphics are your case. This pertains especially to jurors, for whom the big takeaways are what they see on screen or on the boards you put in front of them. Themes, chronologies, evidence and arguments can and should be woven into, and given substance by, your graphics.
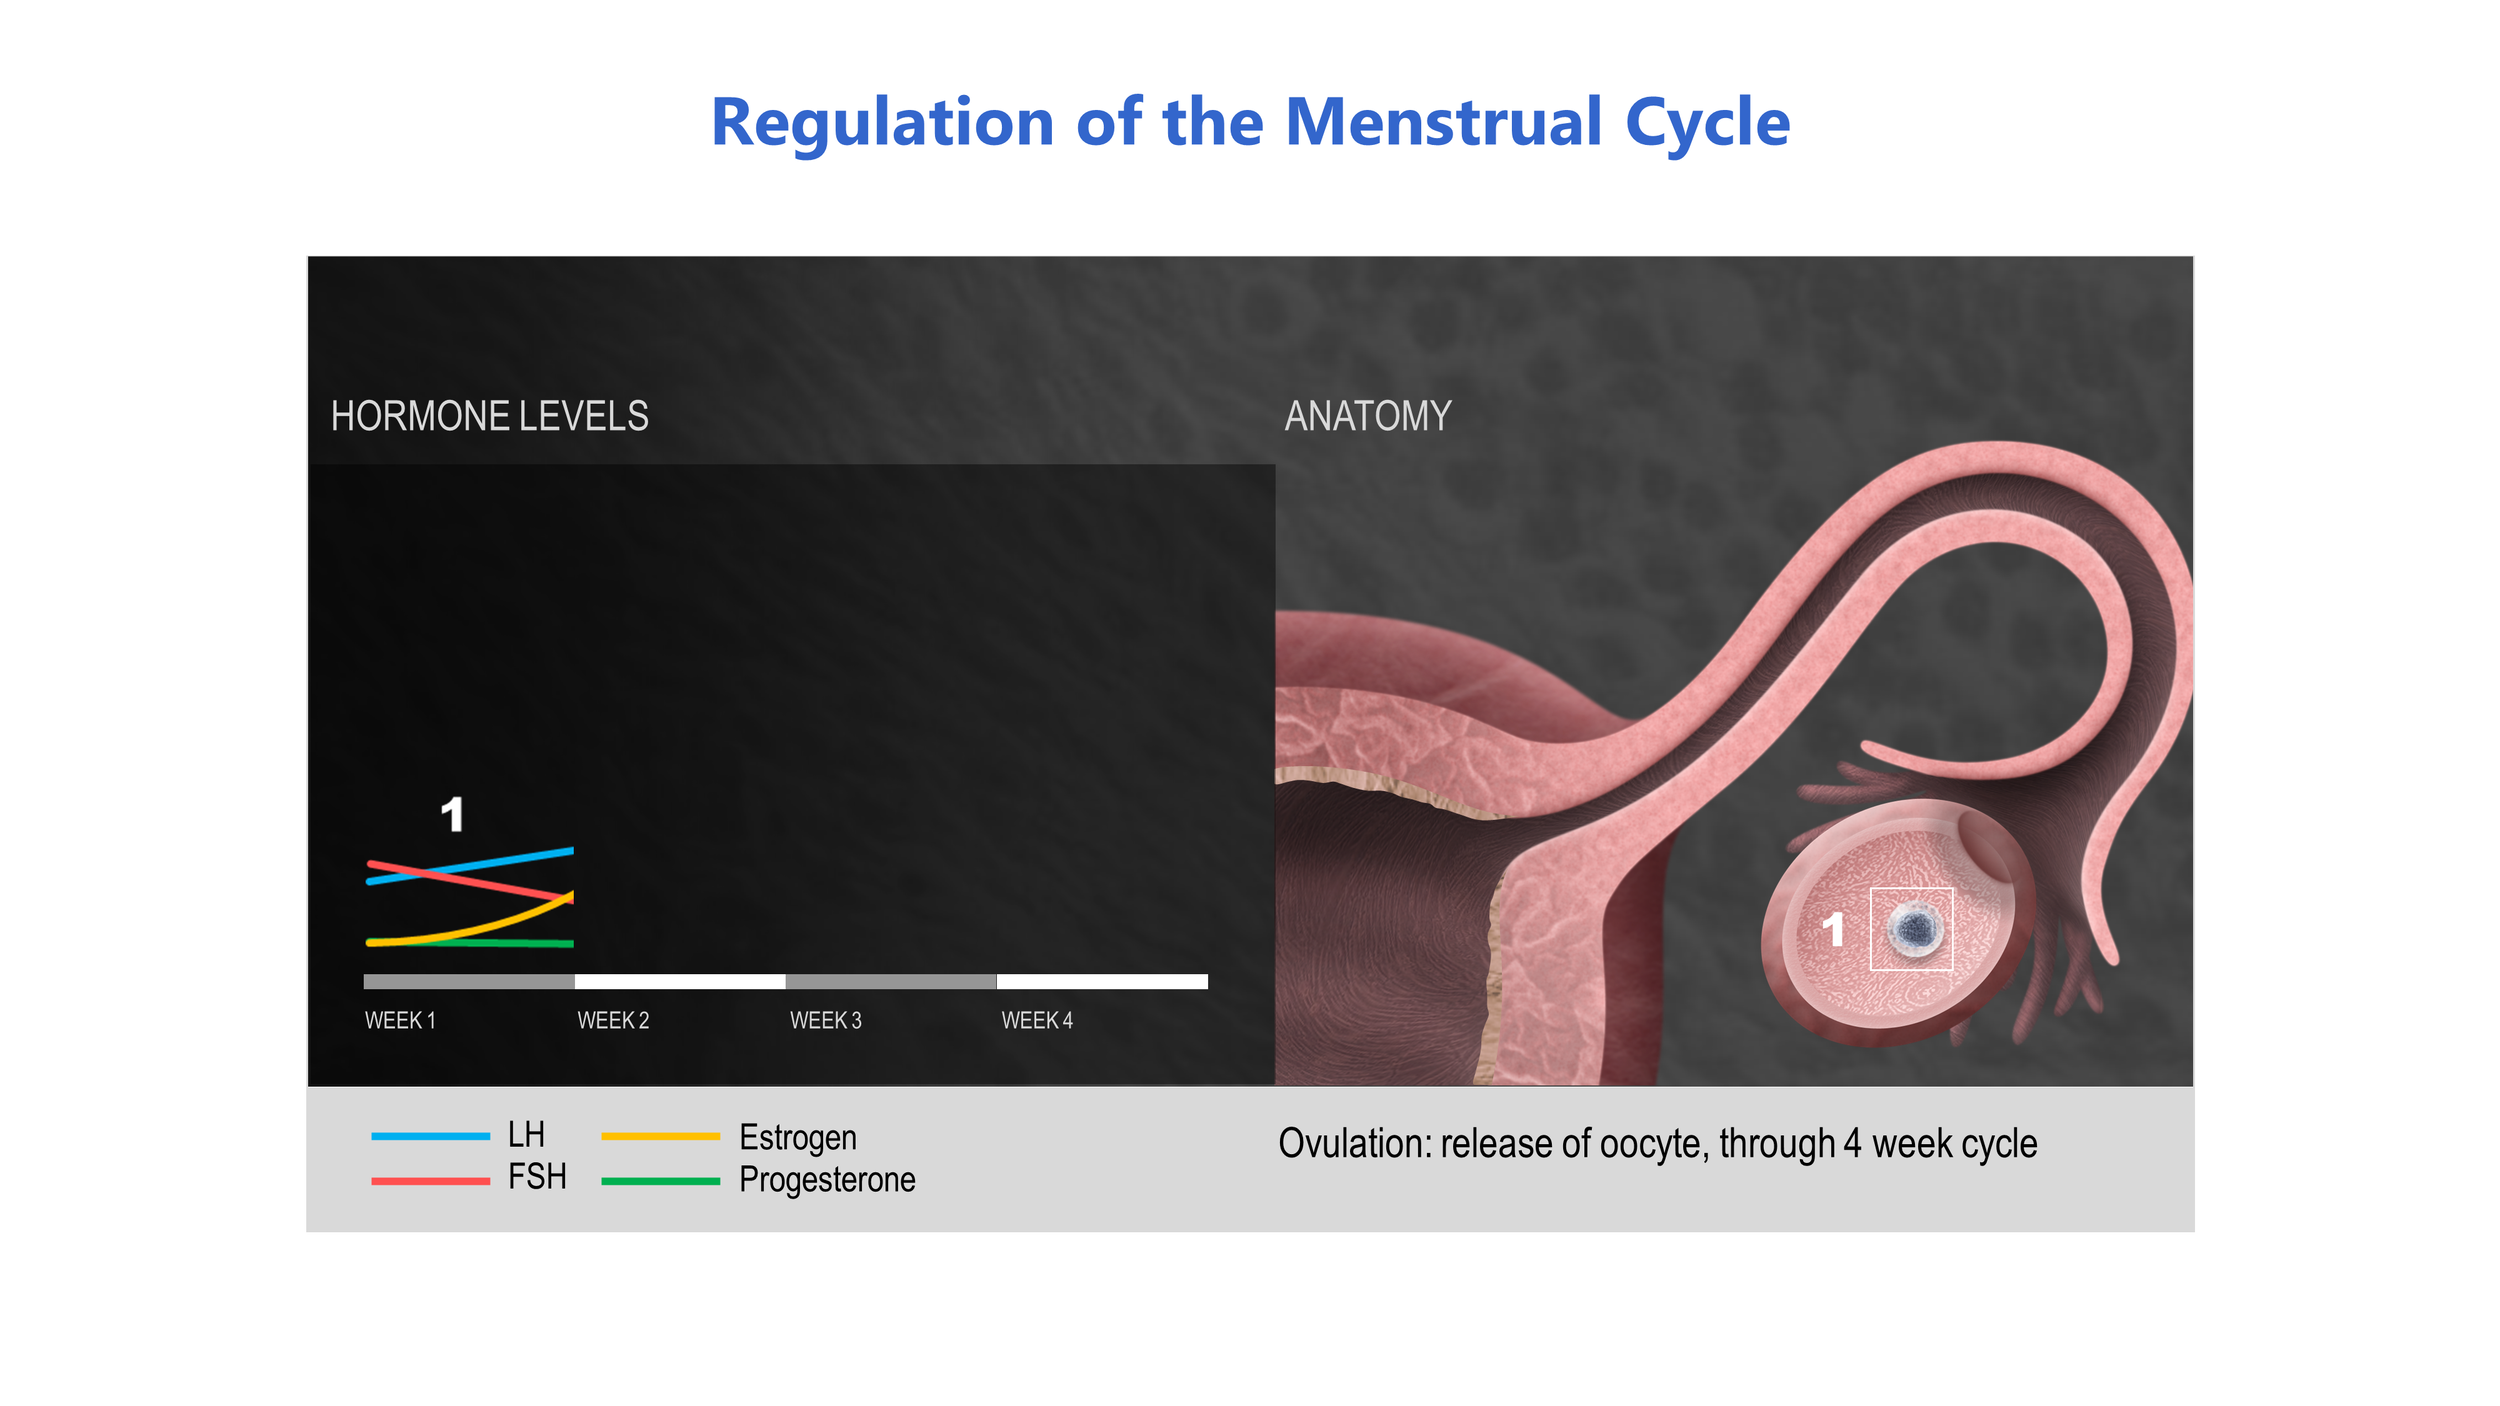
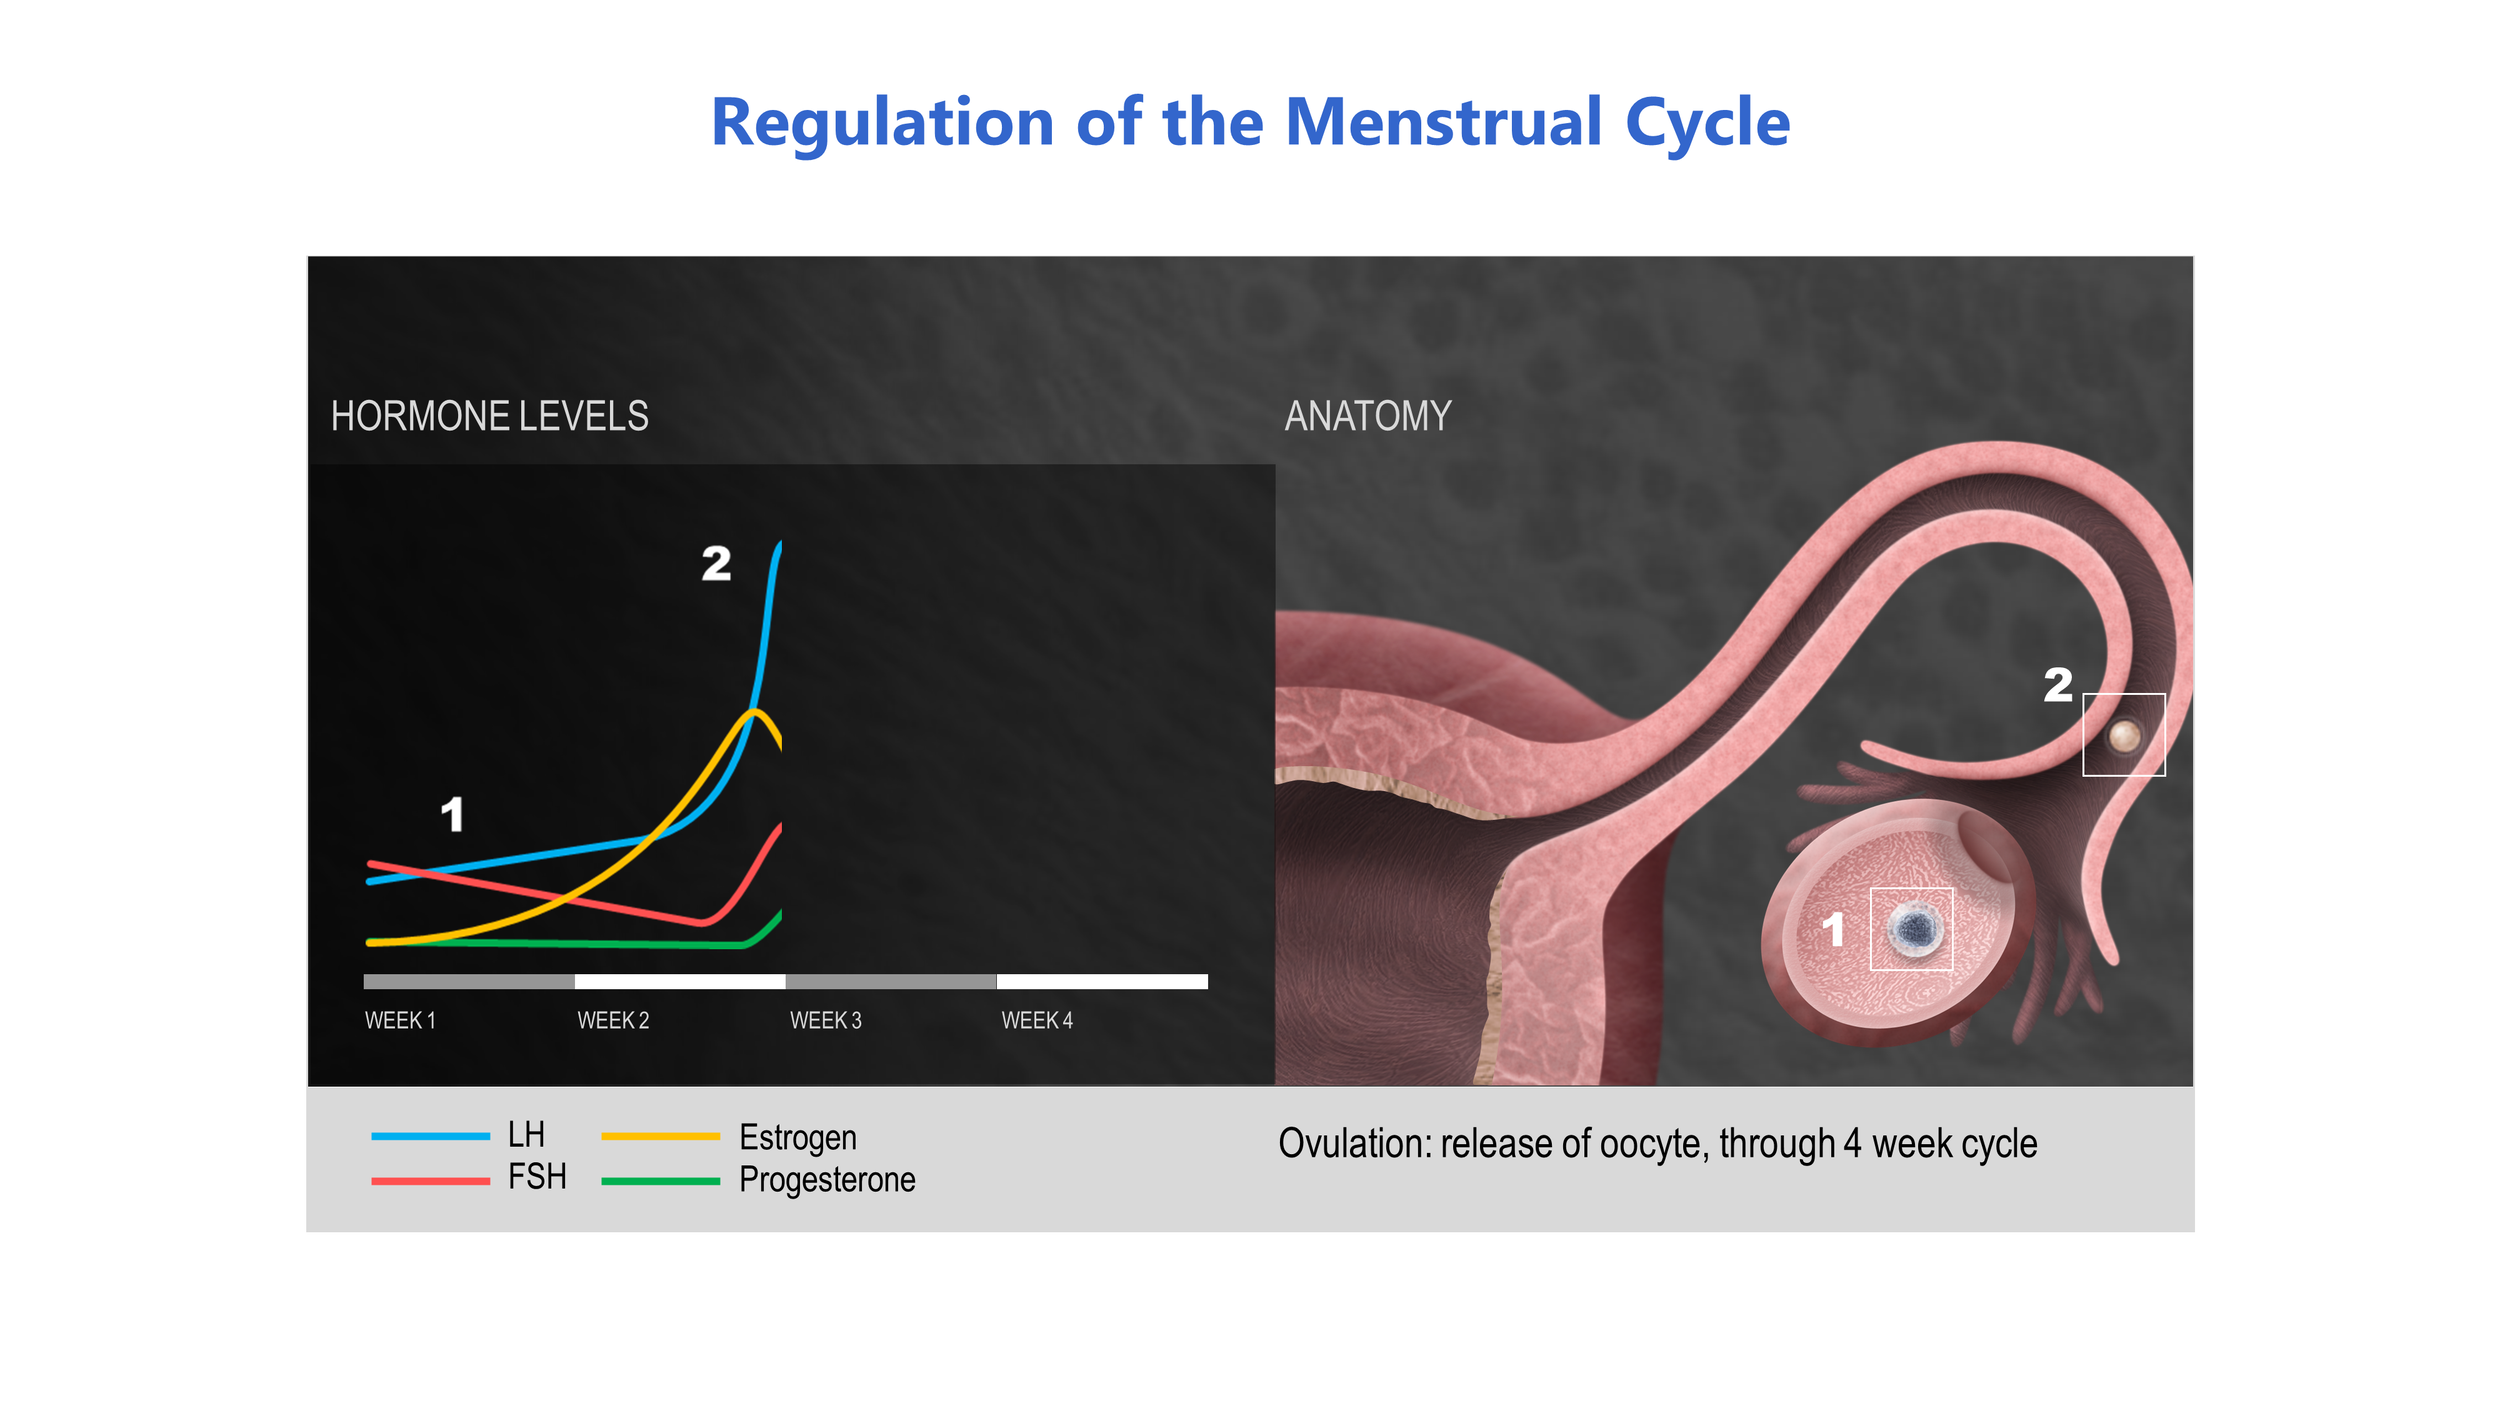
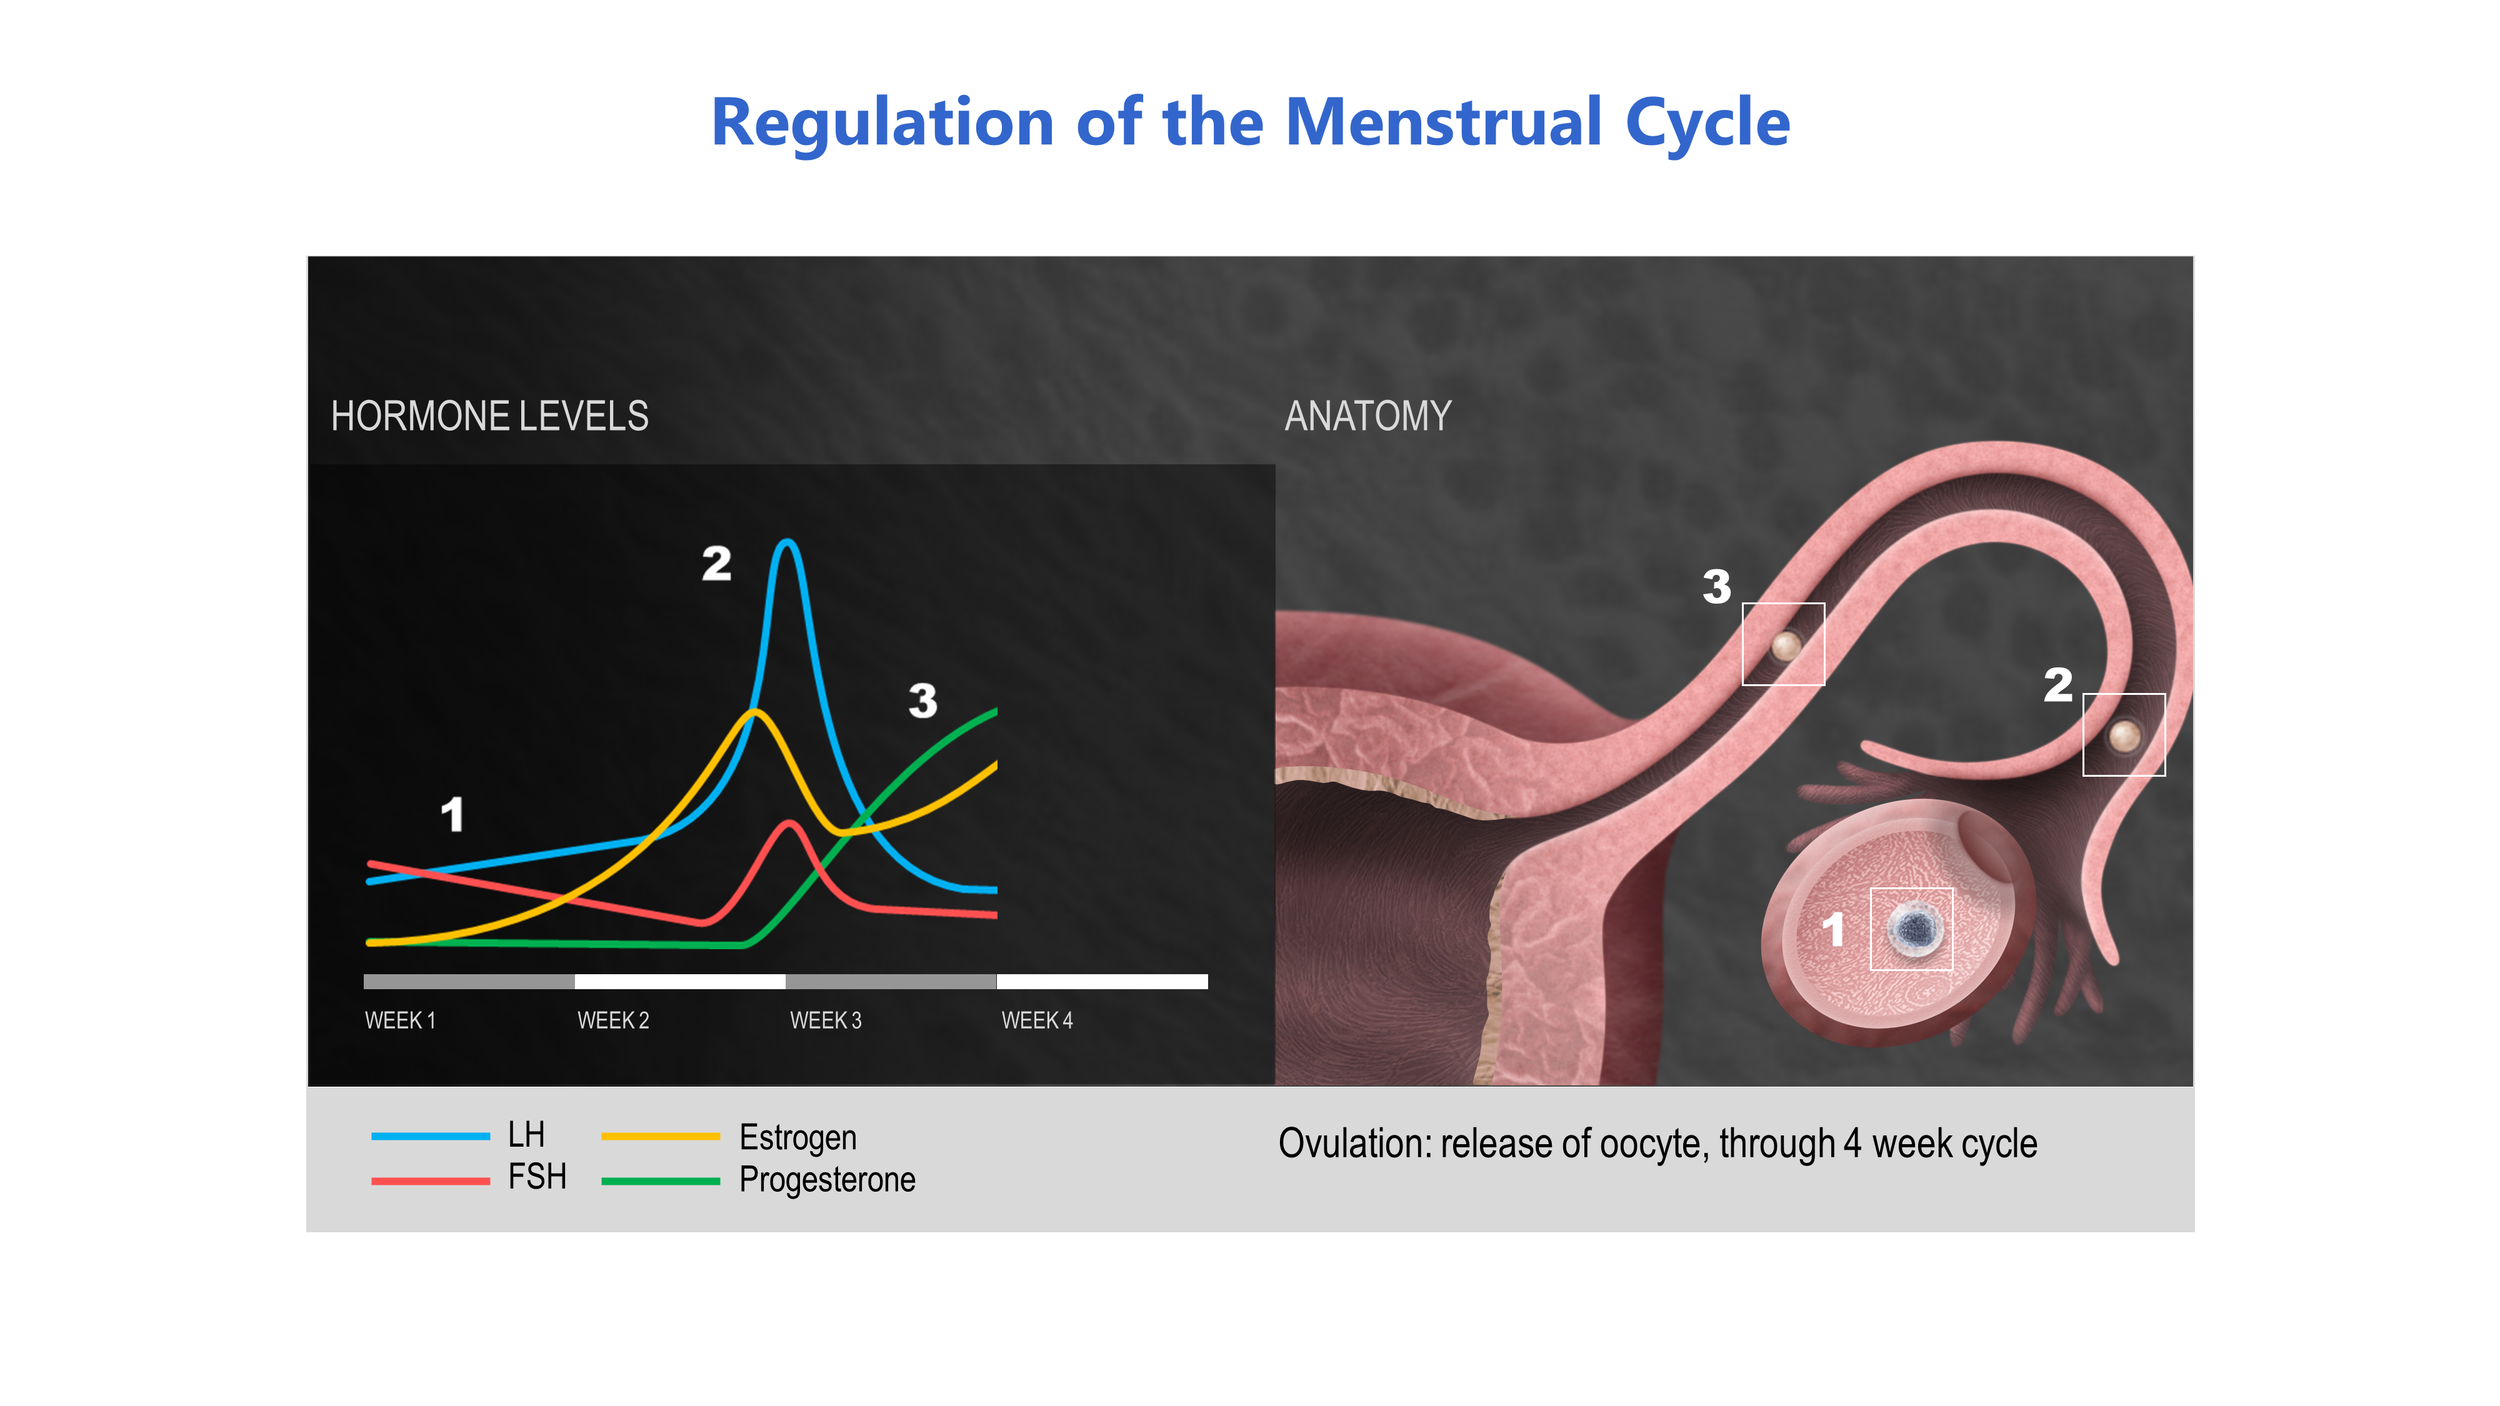
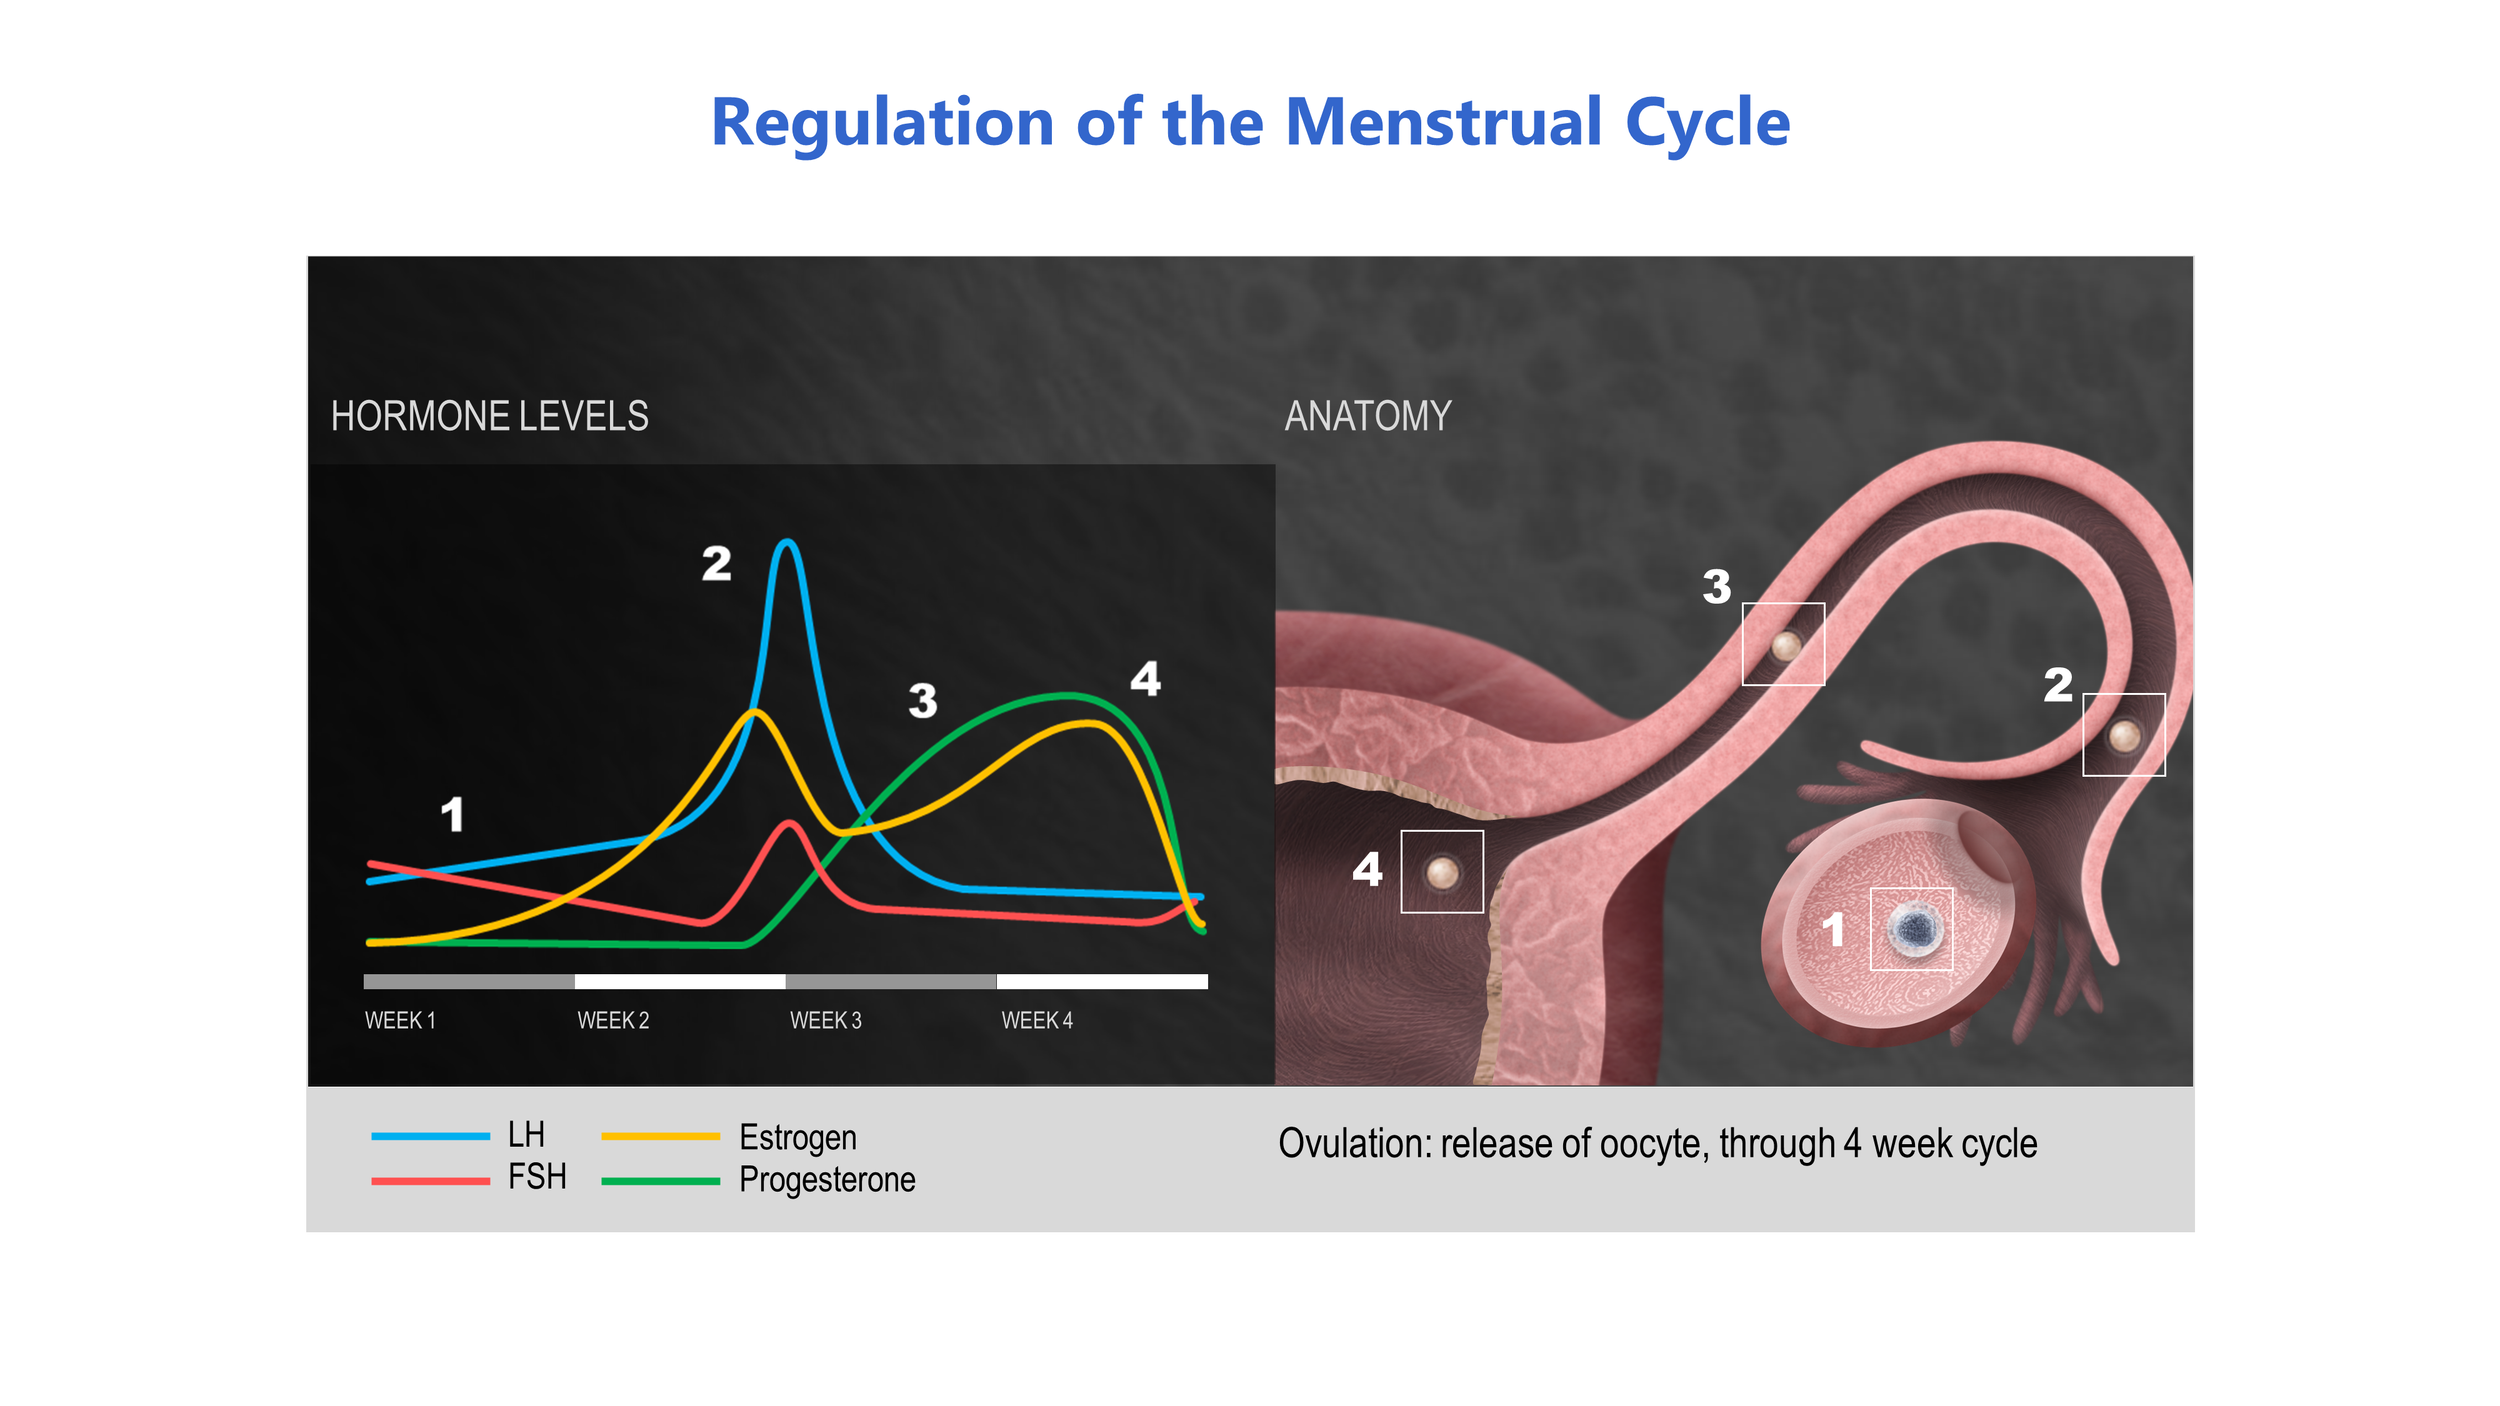
The 2D illustration / animation below was used to explain the phases of the menstrual cycle and how a patented oral contraceptive worked to alter the subject’s hormonal levels and prevent conception.

How to use graphics to try complex cases
Complex or quantitative information can be incredibly powerful… if it’s presented well. Learn the tenants of what makes a design “good” and how you can leverage not-so-simple information to connect with judges and juries.
If you’re getting serious about creating powerful presentations, a great resource to reference is Edward Tufte’s influential book, The Visual Display of Quantitative Information. In his chapter on what he calls “graphical excellence” are several takeaways that we regularly leverage when creating graphics for to explain quantitative or complicated information:
First, “show the data”: Once made sensitive to this, you can never look at a chart or graph again without noticing whether the author/artist is doing so. Clearly labeling the values, x- and y-limits, units, and citing to source convey important information. Just as importantly, these detailed bits are what I call indicia of authenticity in that they communicate a degree of care that suggests truth and precision. That is the impression you want to create when submitting a report or presenting at trial.

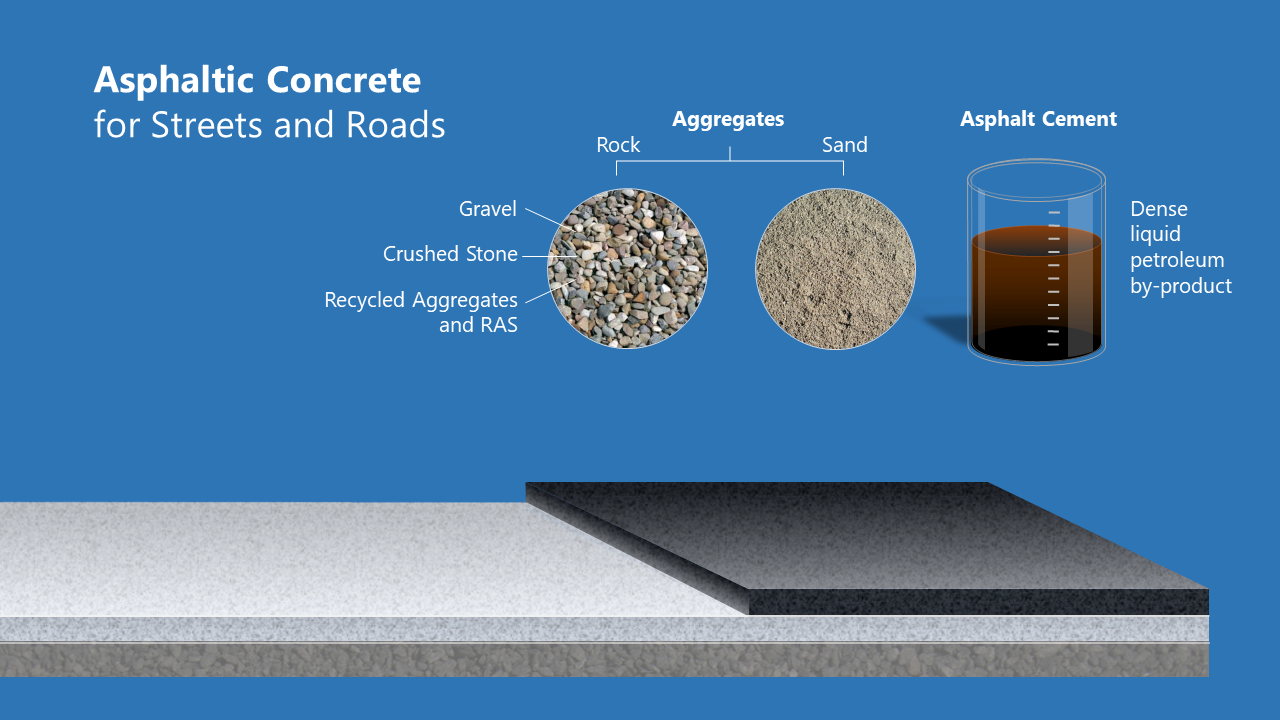
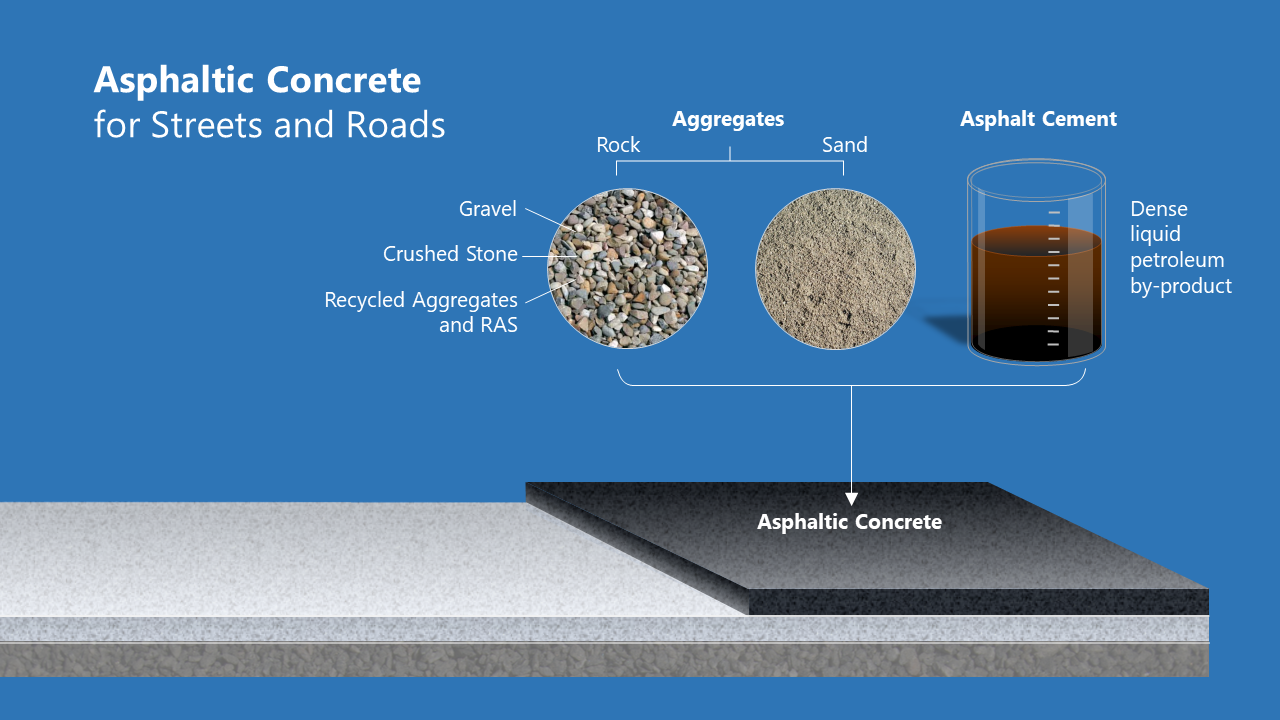
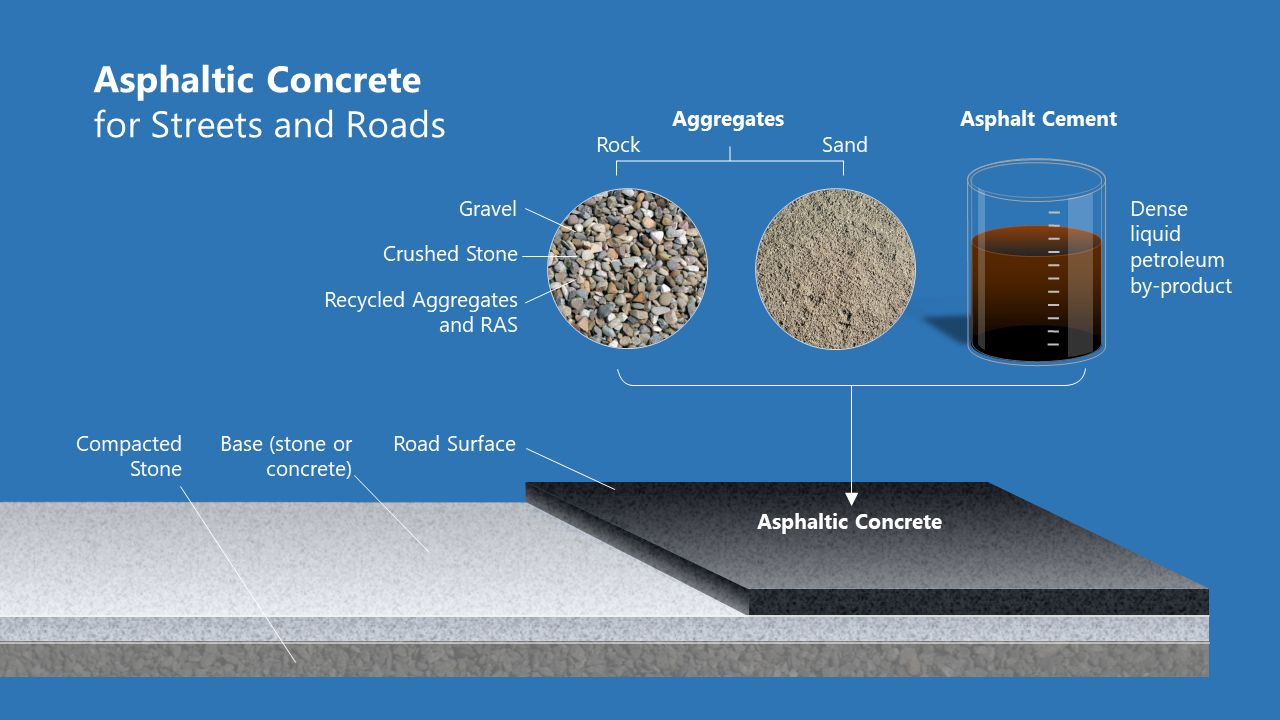
Here, we combine a timeline, a graph and an illustration, creating a single visual. This supported discussion of the thickness and weight of asphalt, which over years built up on the road surface of a highway bridge. It catastrophically failed.
Second, "induce the viewer to think about the substance": This tenant is as opposed to thinking about what technique or enhancement the artist is using. The technique used to present the data should be consistent with the nature of the data and the takeaway you are offering your audience. The gift is your message, not the wrapping paper.
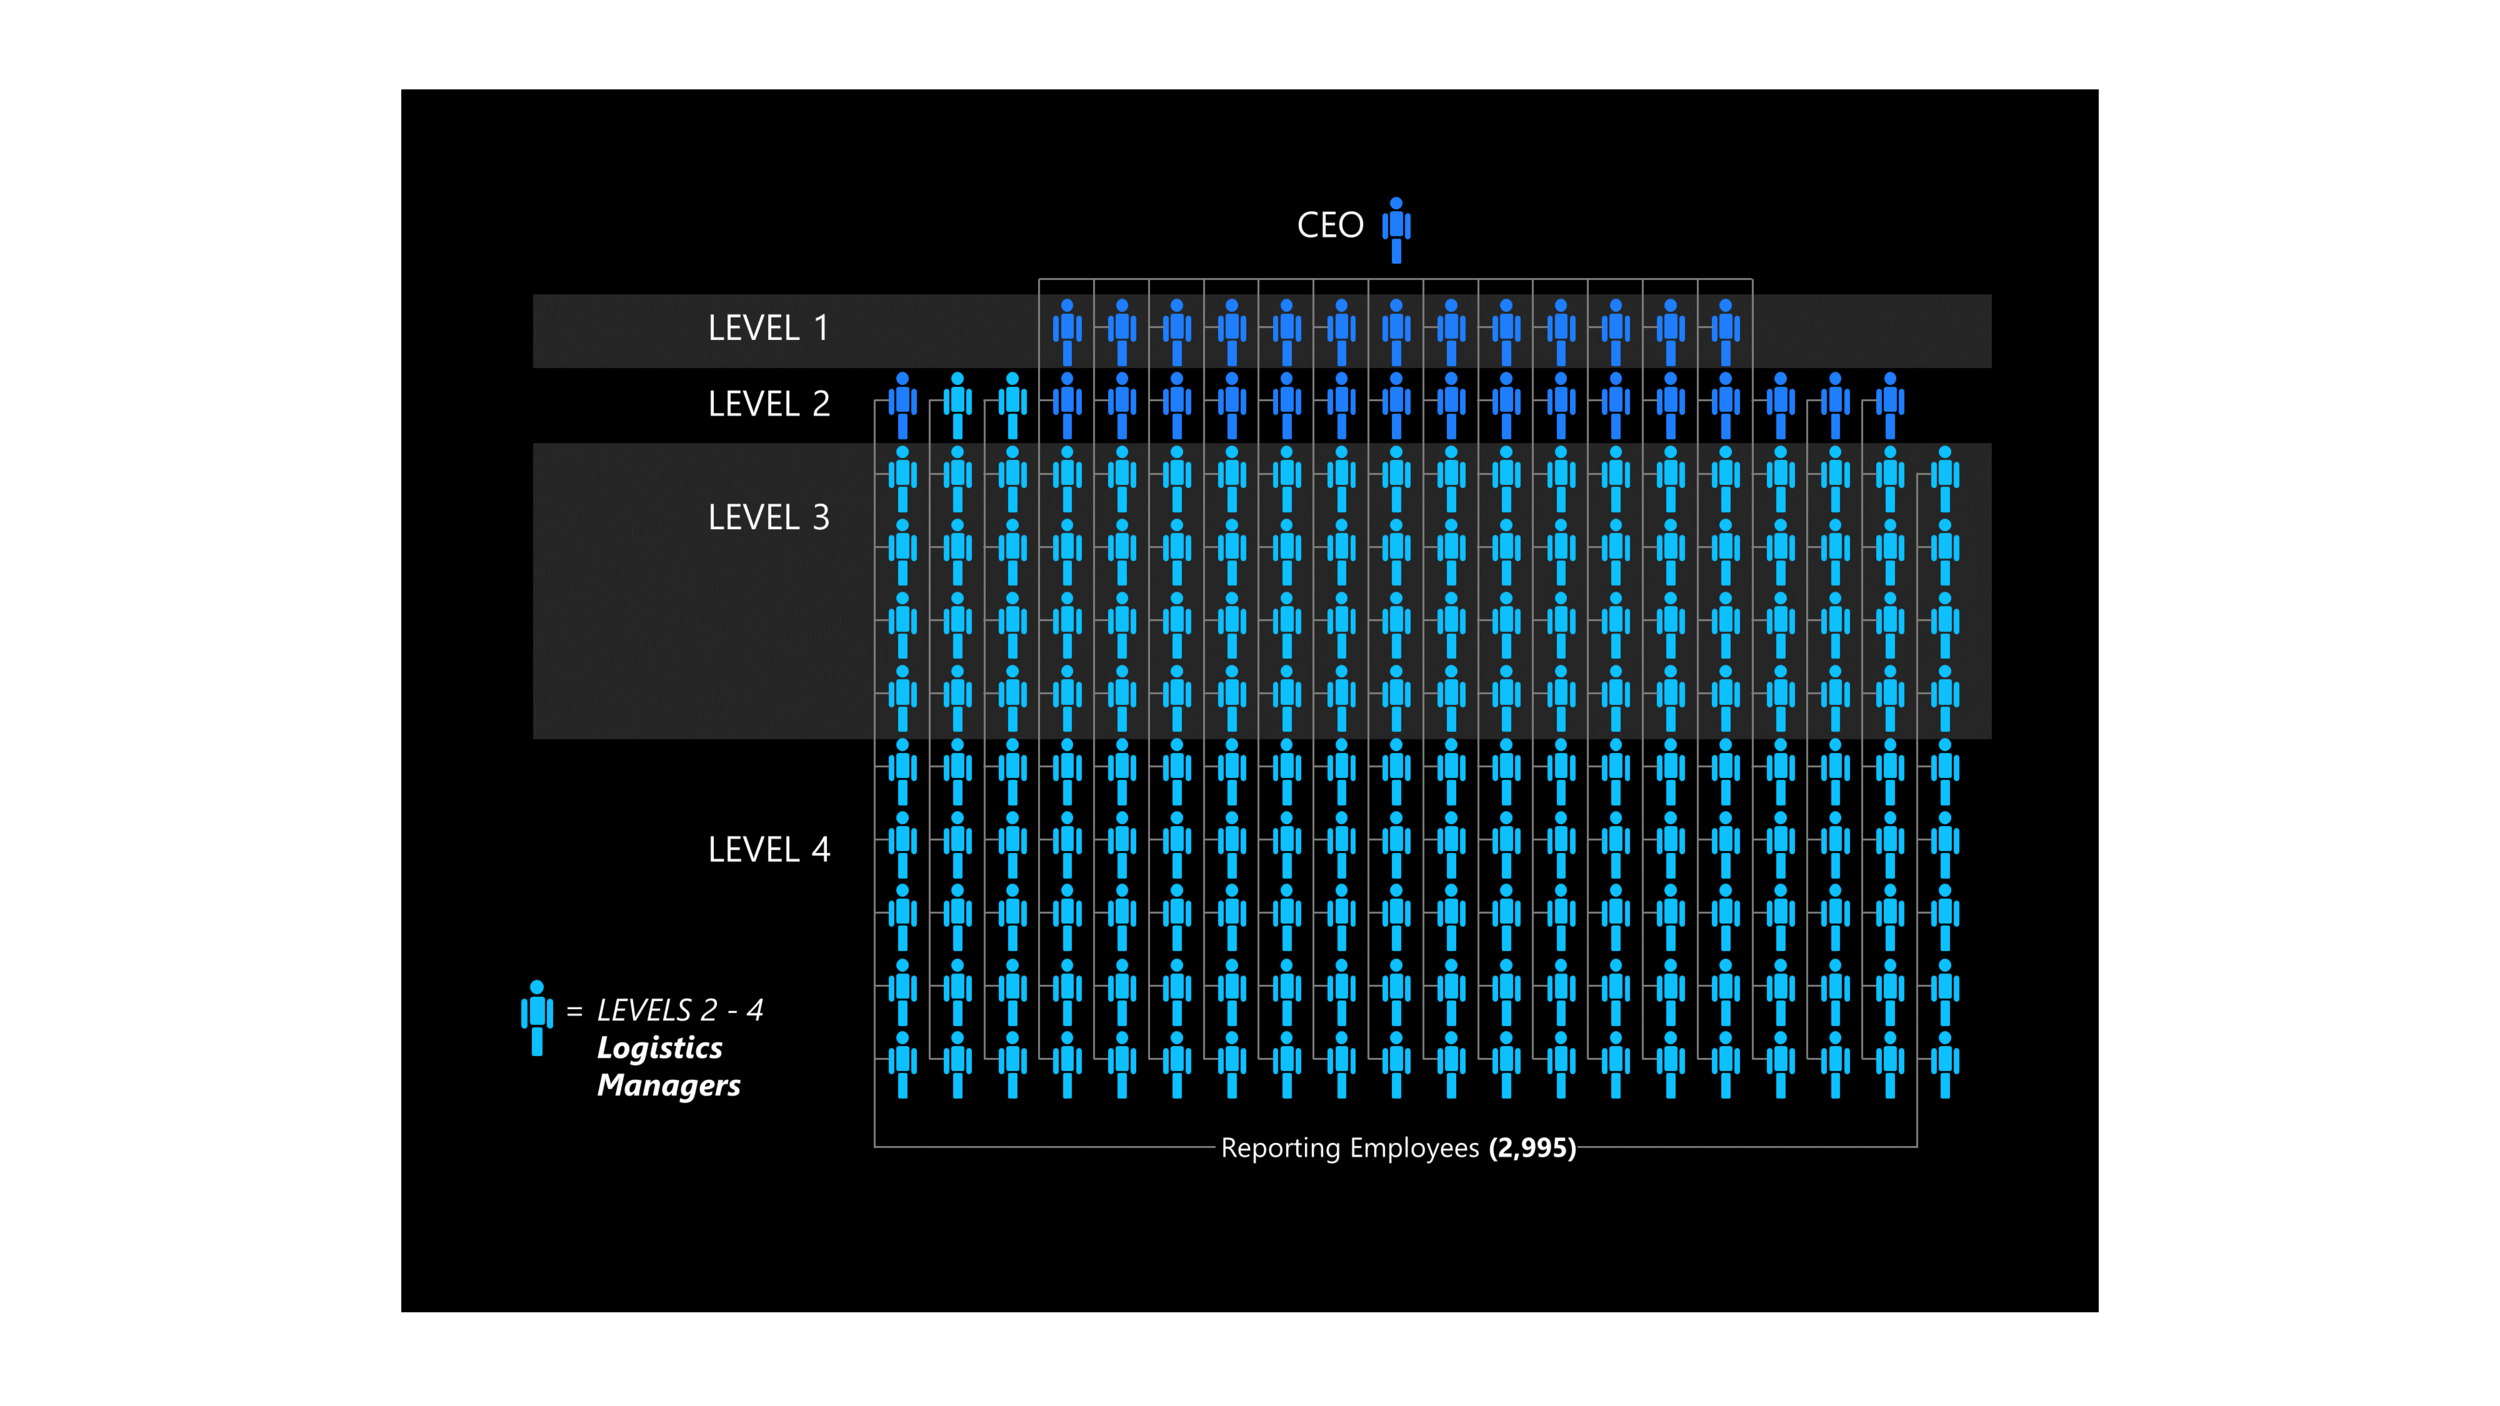
The simple use of iconography can help maintain viewers’ focus on the subject matter at hand. Here, for example, we see not just numbers, but numbers of people.
And third, “don’t distort what the data has to say”: This one is crucial for lawyers, their experts and artists to adhere to scrupulously. While that seems obvious, experience shows that it bears repeating. The consequences of misrepresenting data are so dire, one would think it would never happen, but regrettably it does. This has given us more than one opportunity to create corrected versions of opponents’ graphics for our clients to use on cross.
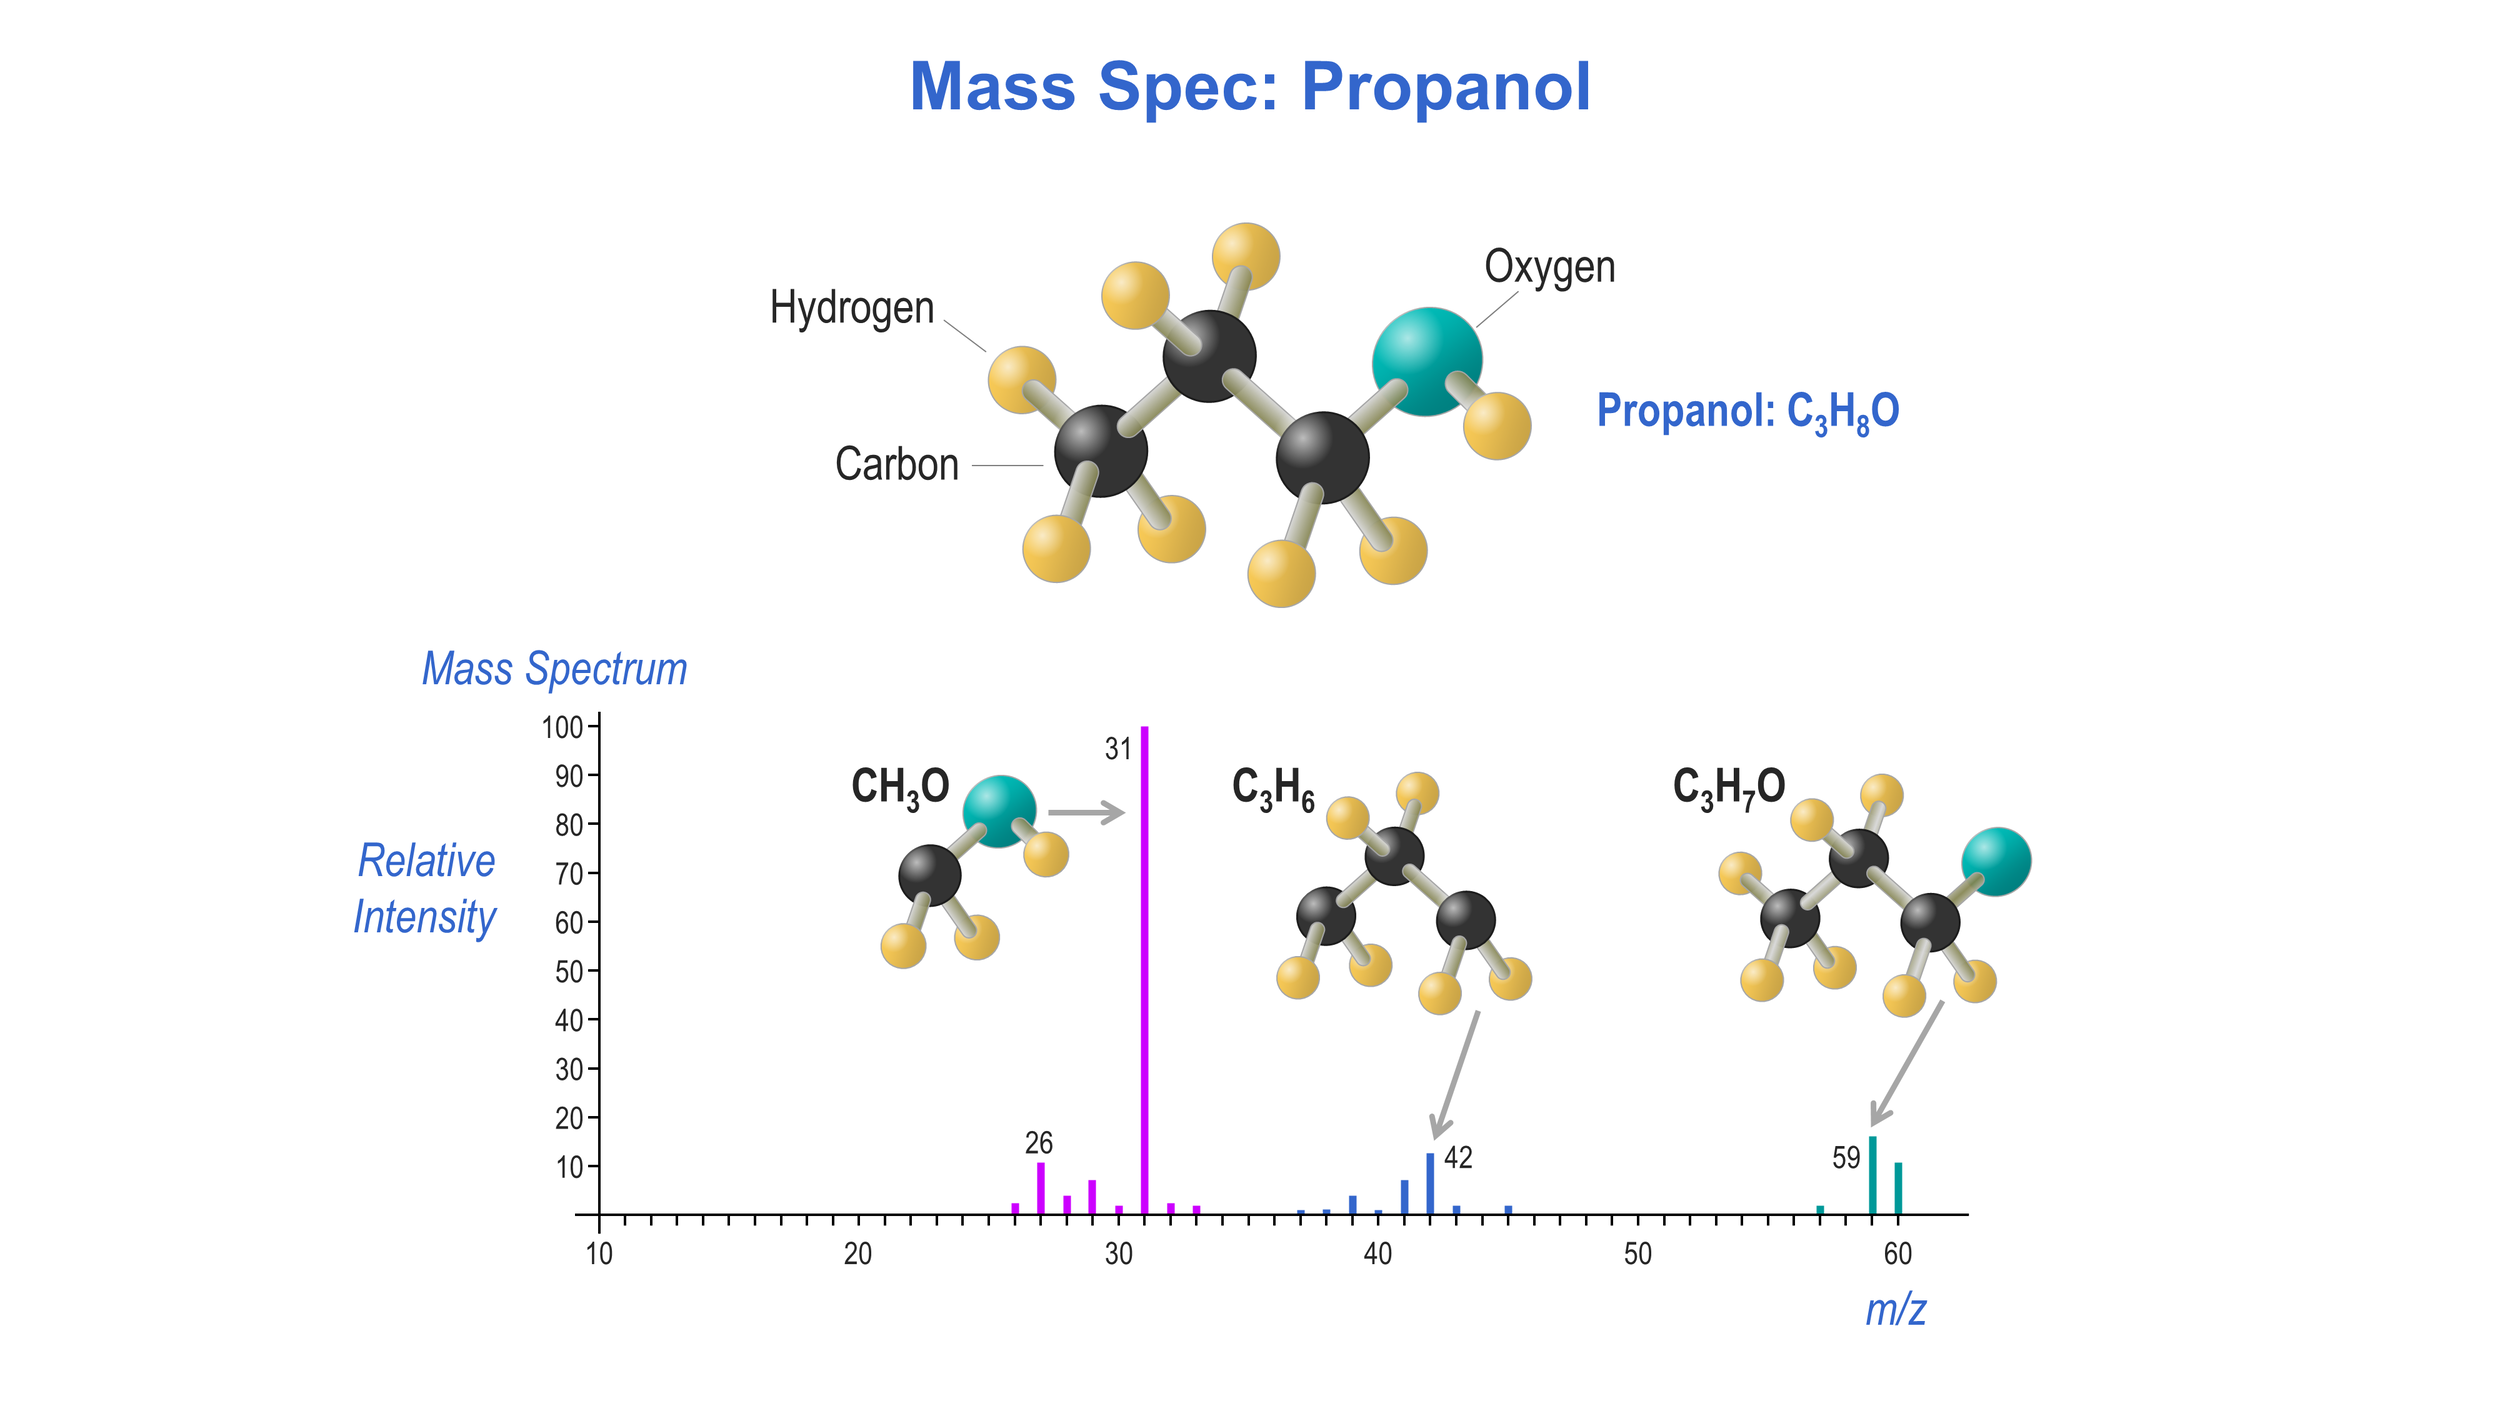
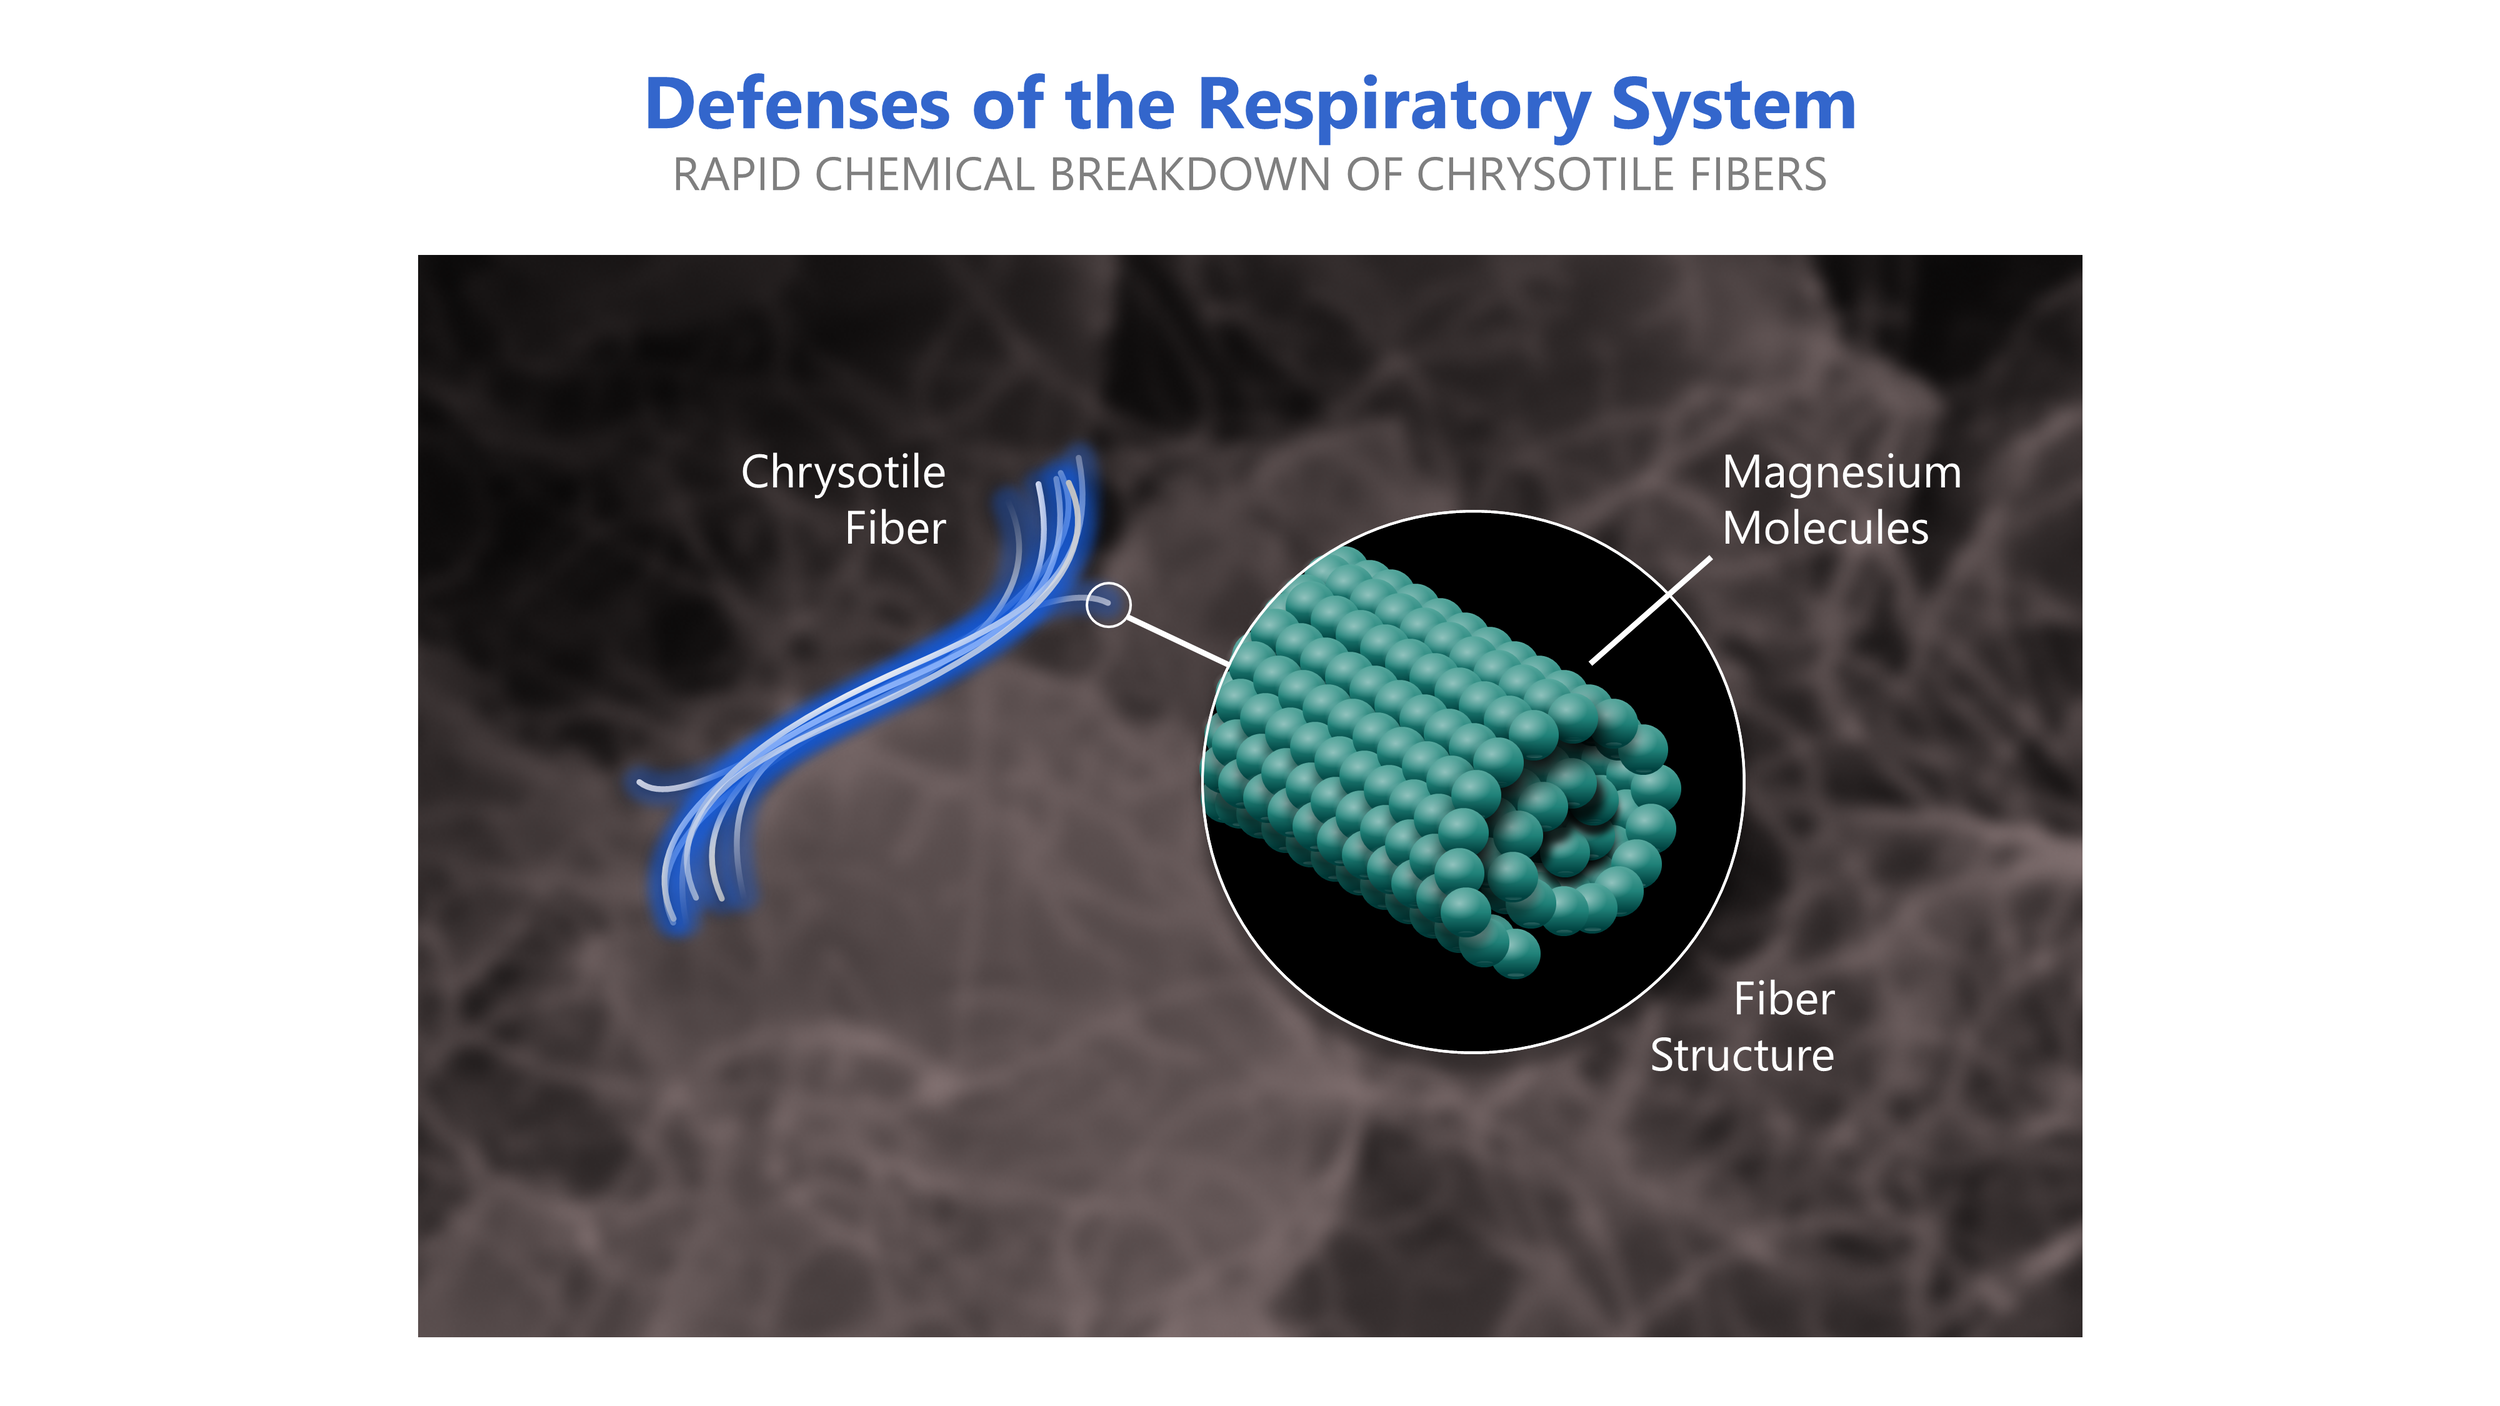
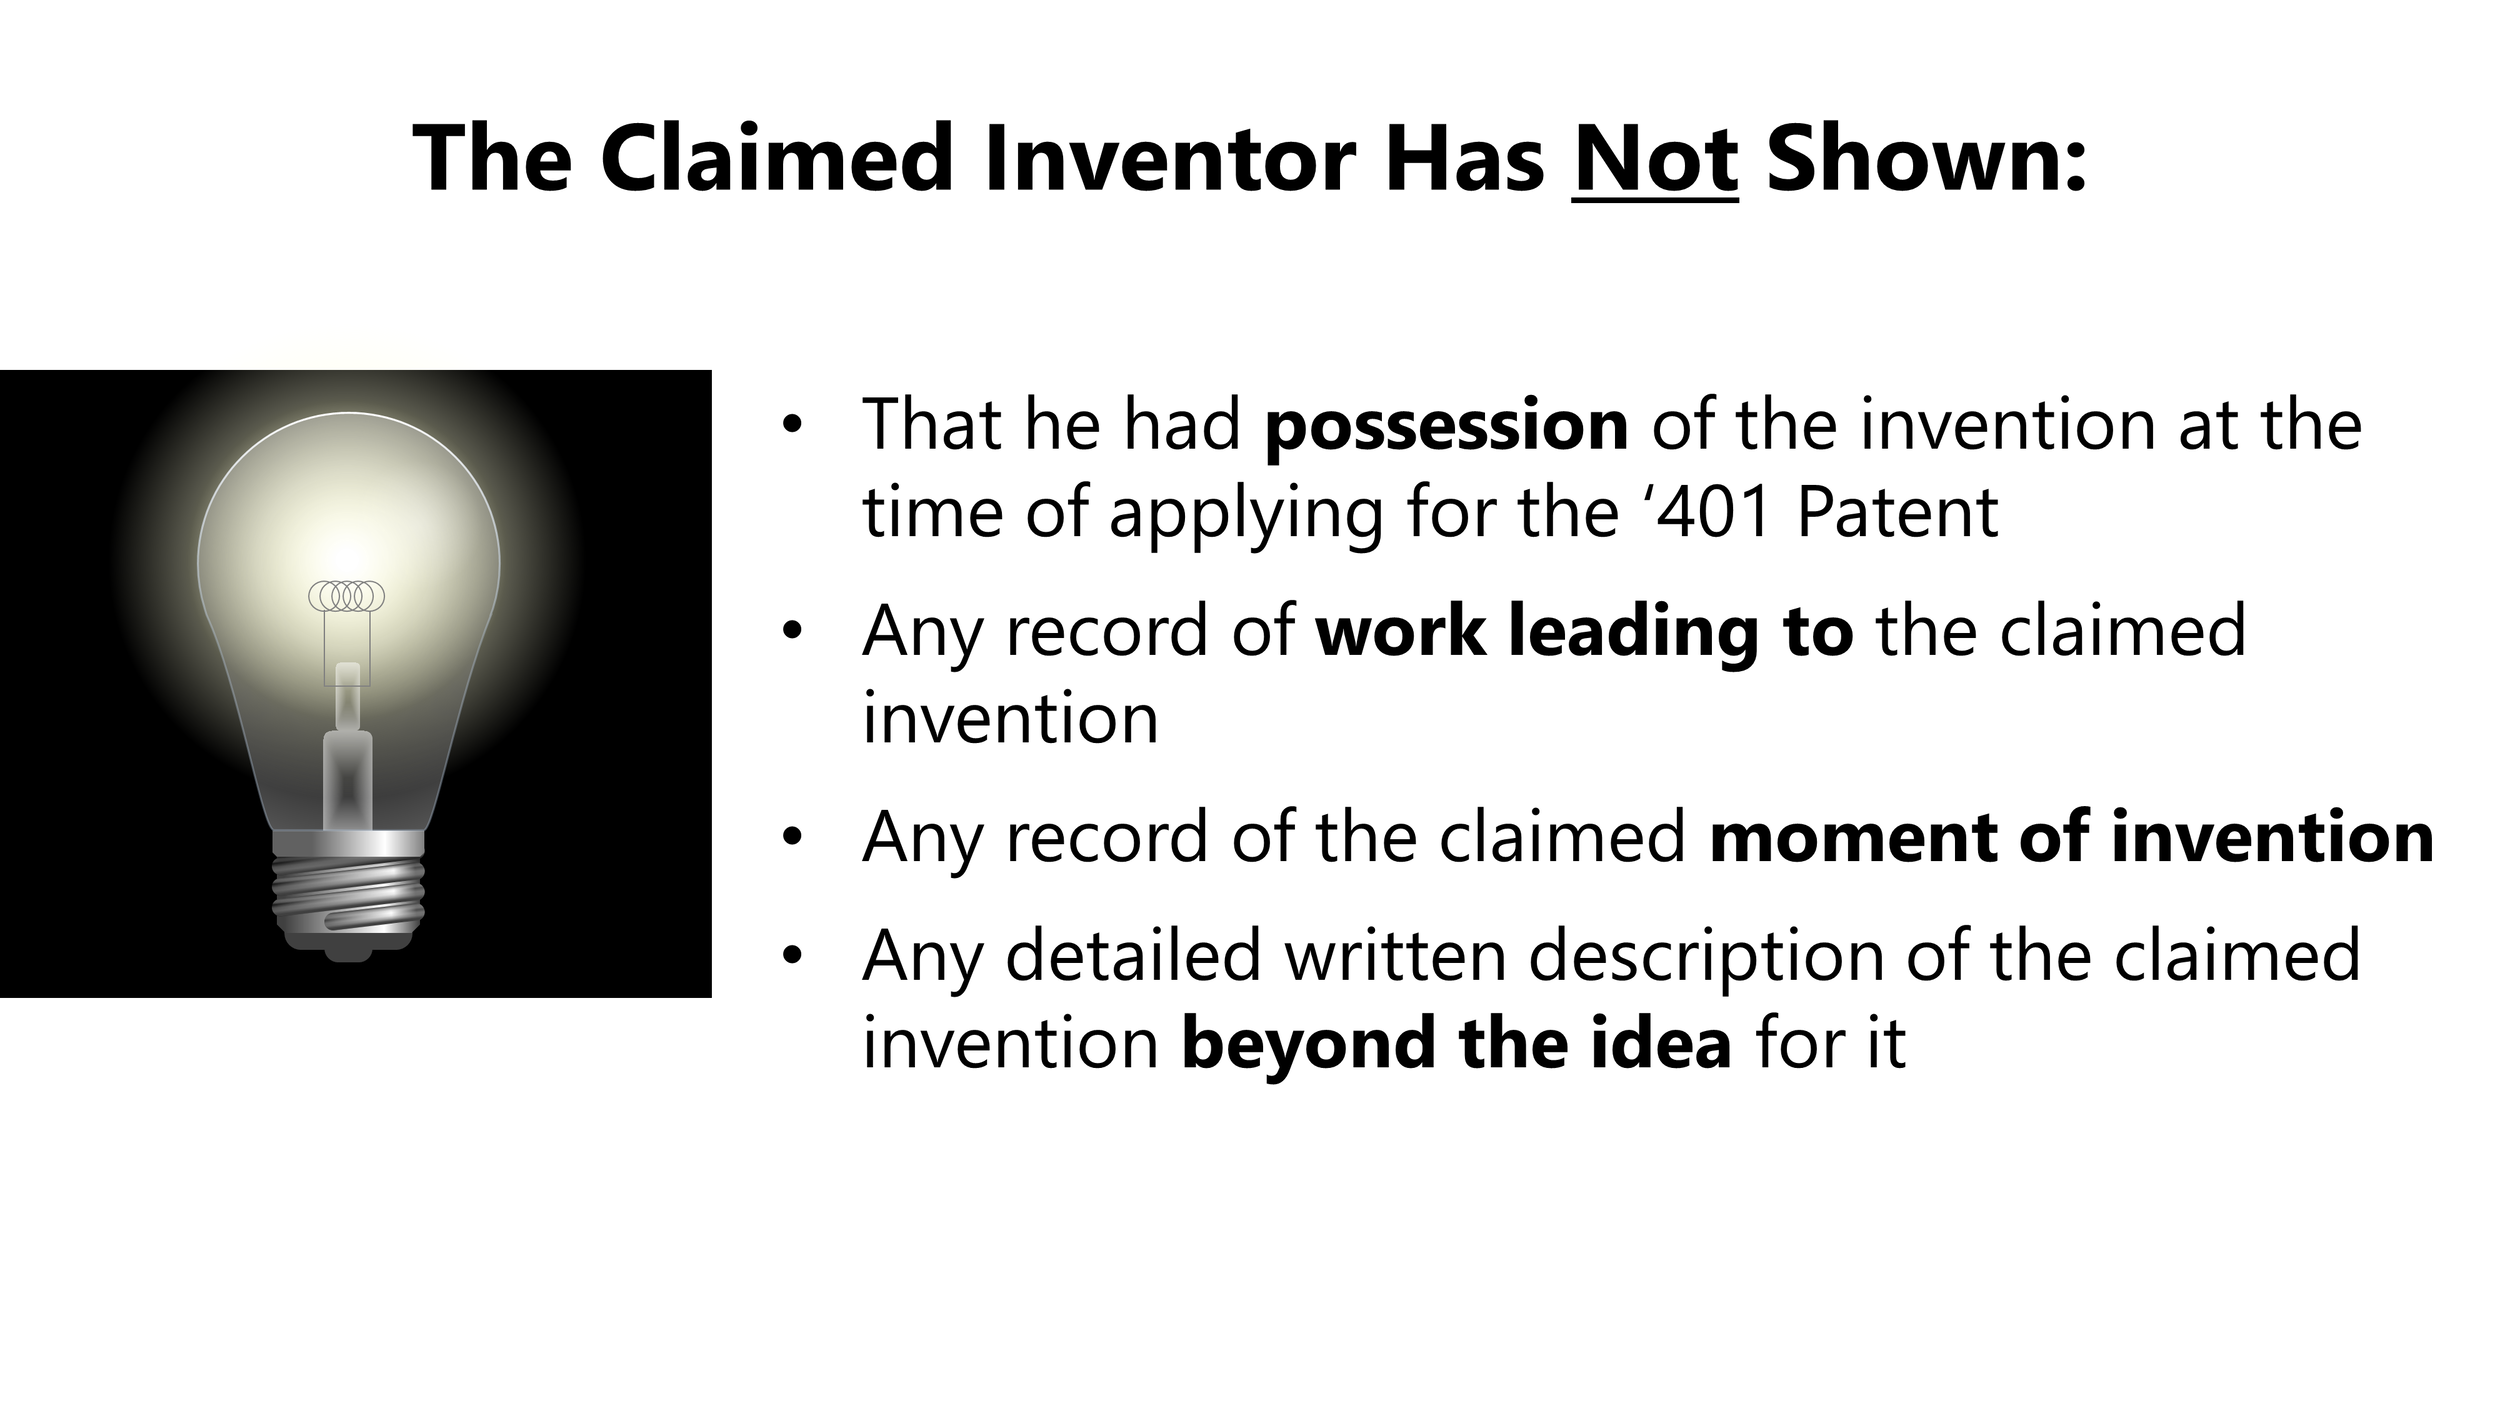
Here we use toy-like illustrations to model the molecular constituents broken out in mass spectrometry. The spectrum graph and chemical names will not be meaningful to most jurors, but all can understand the notion of unplugging different bits to create smaller molecules.
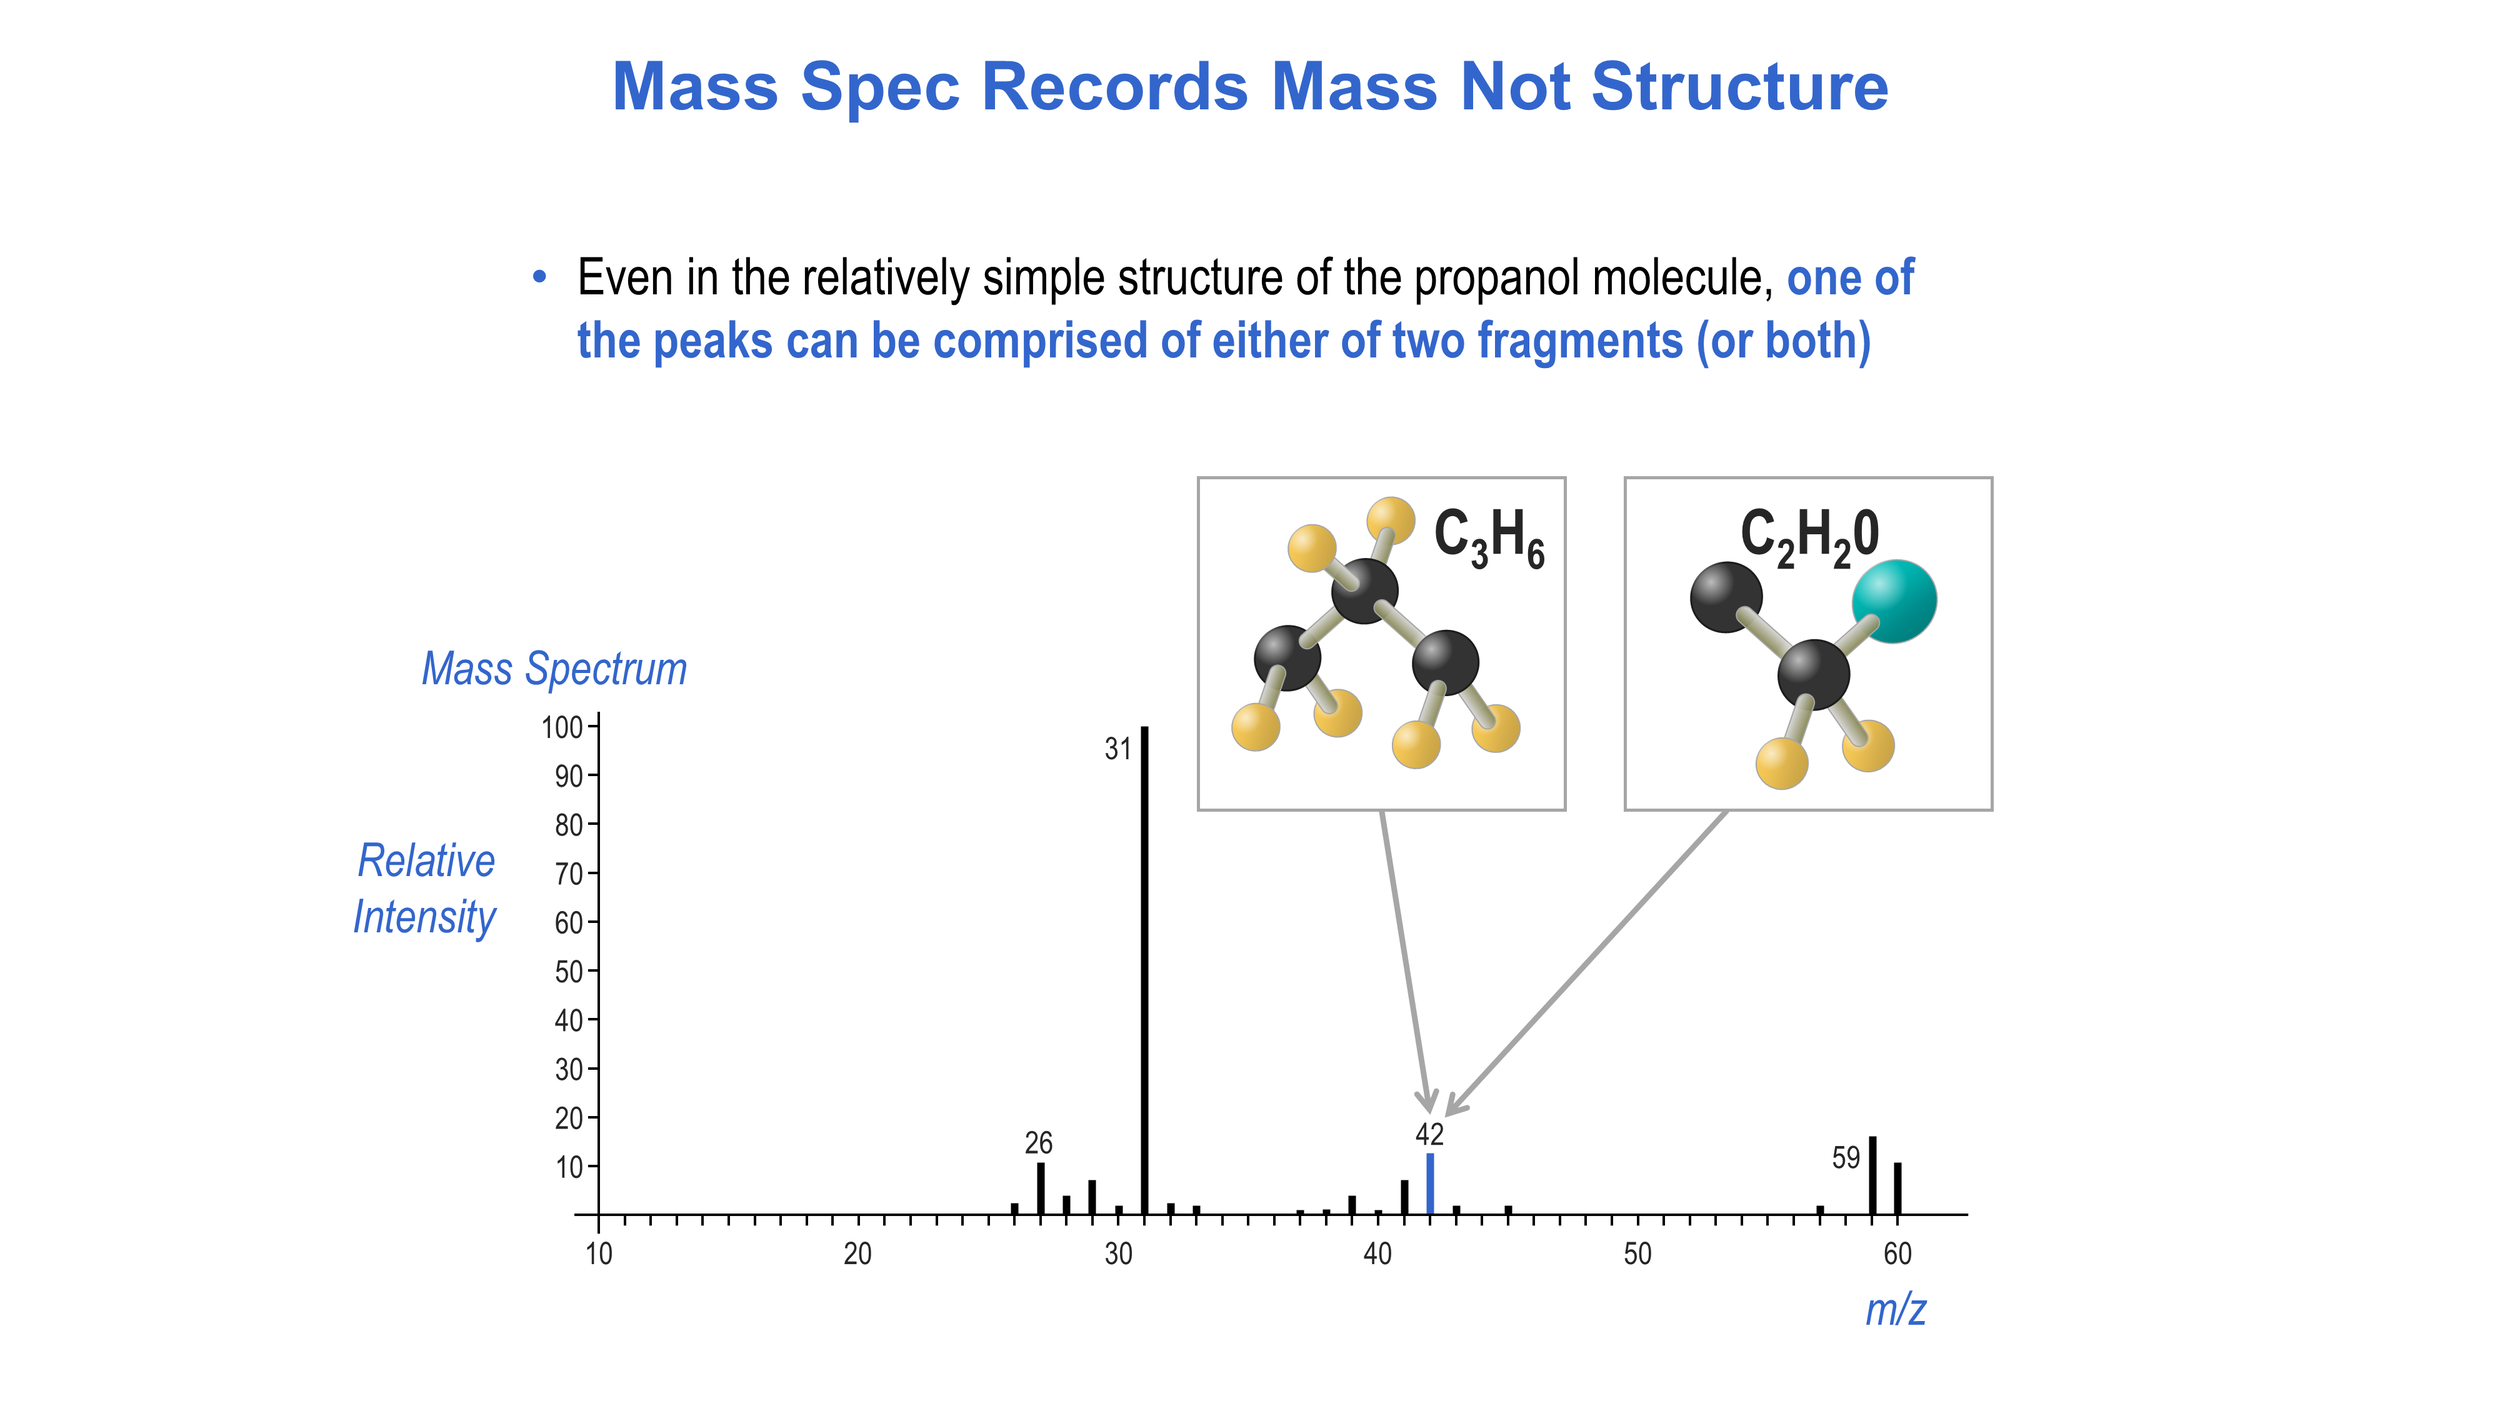
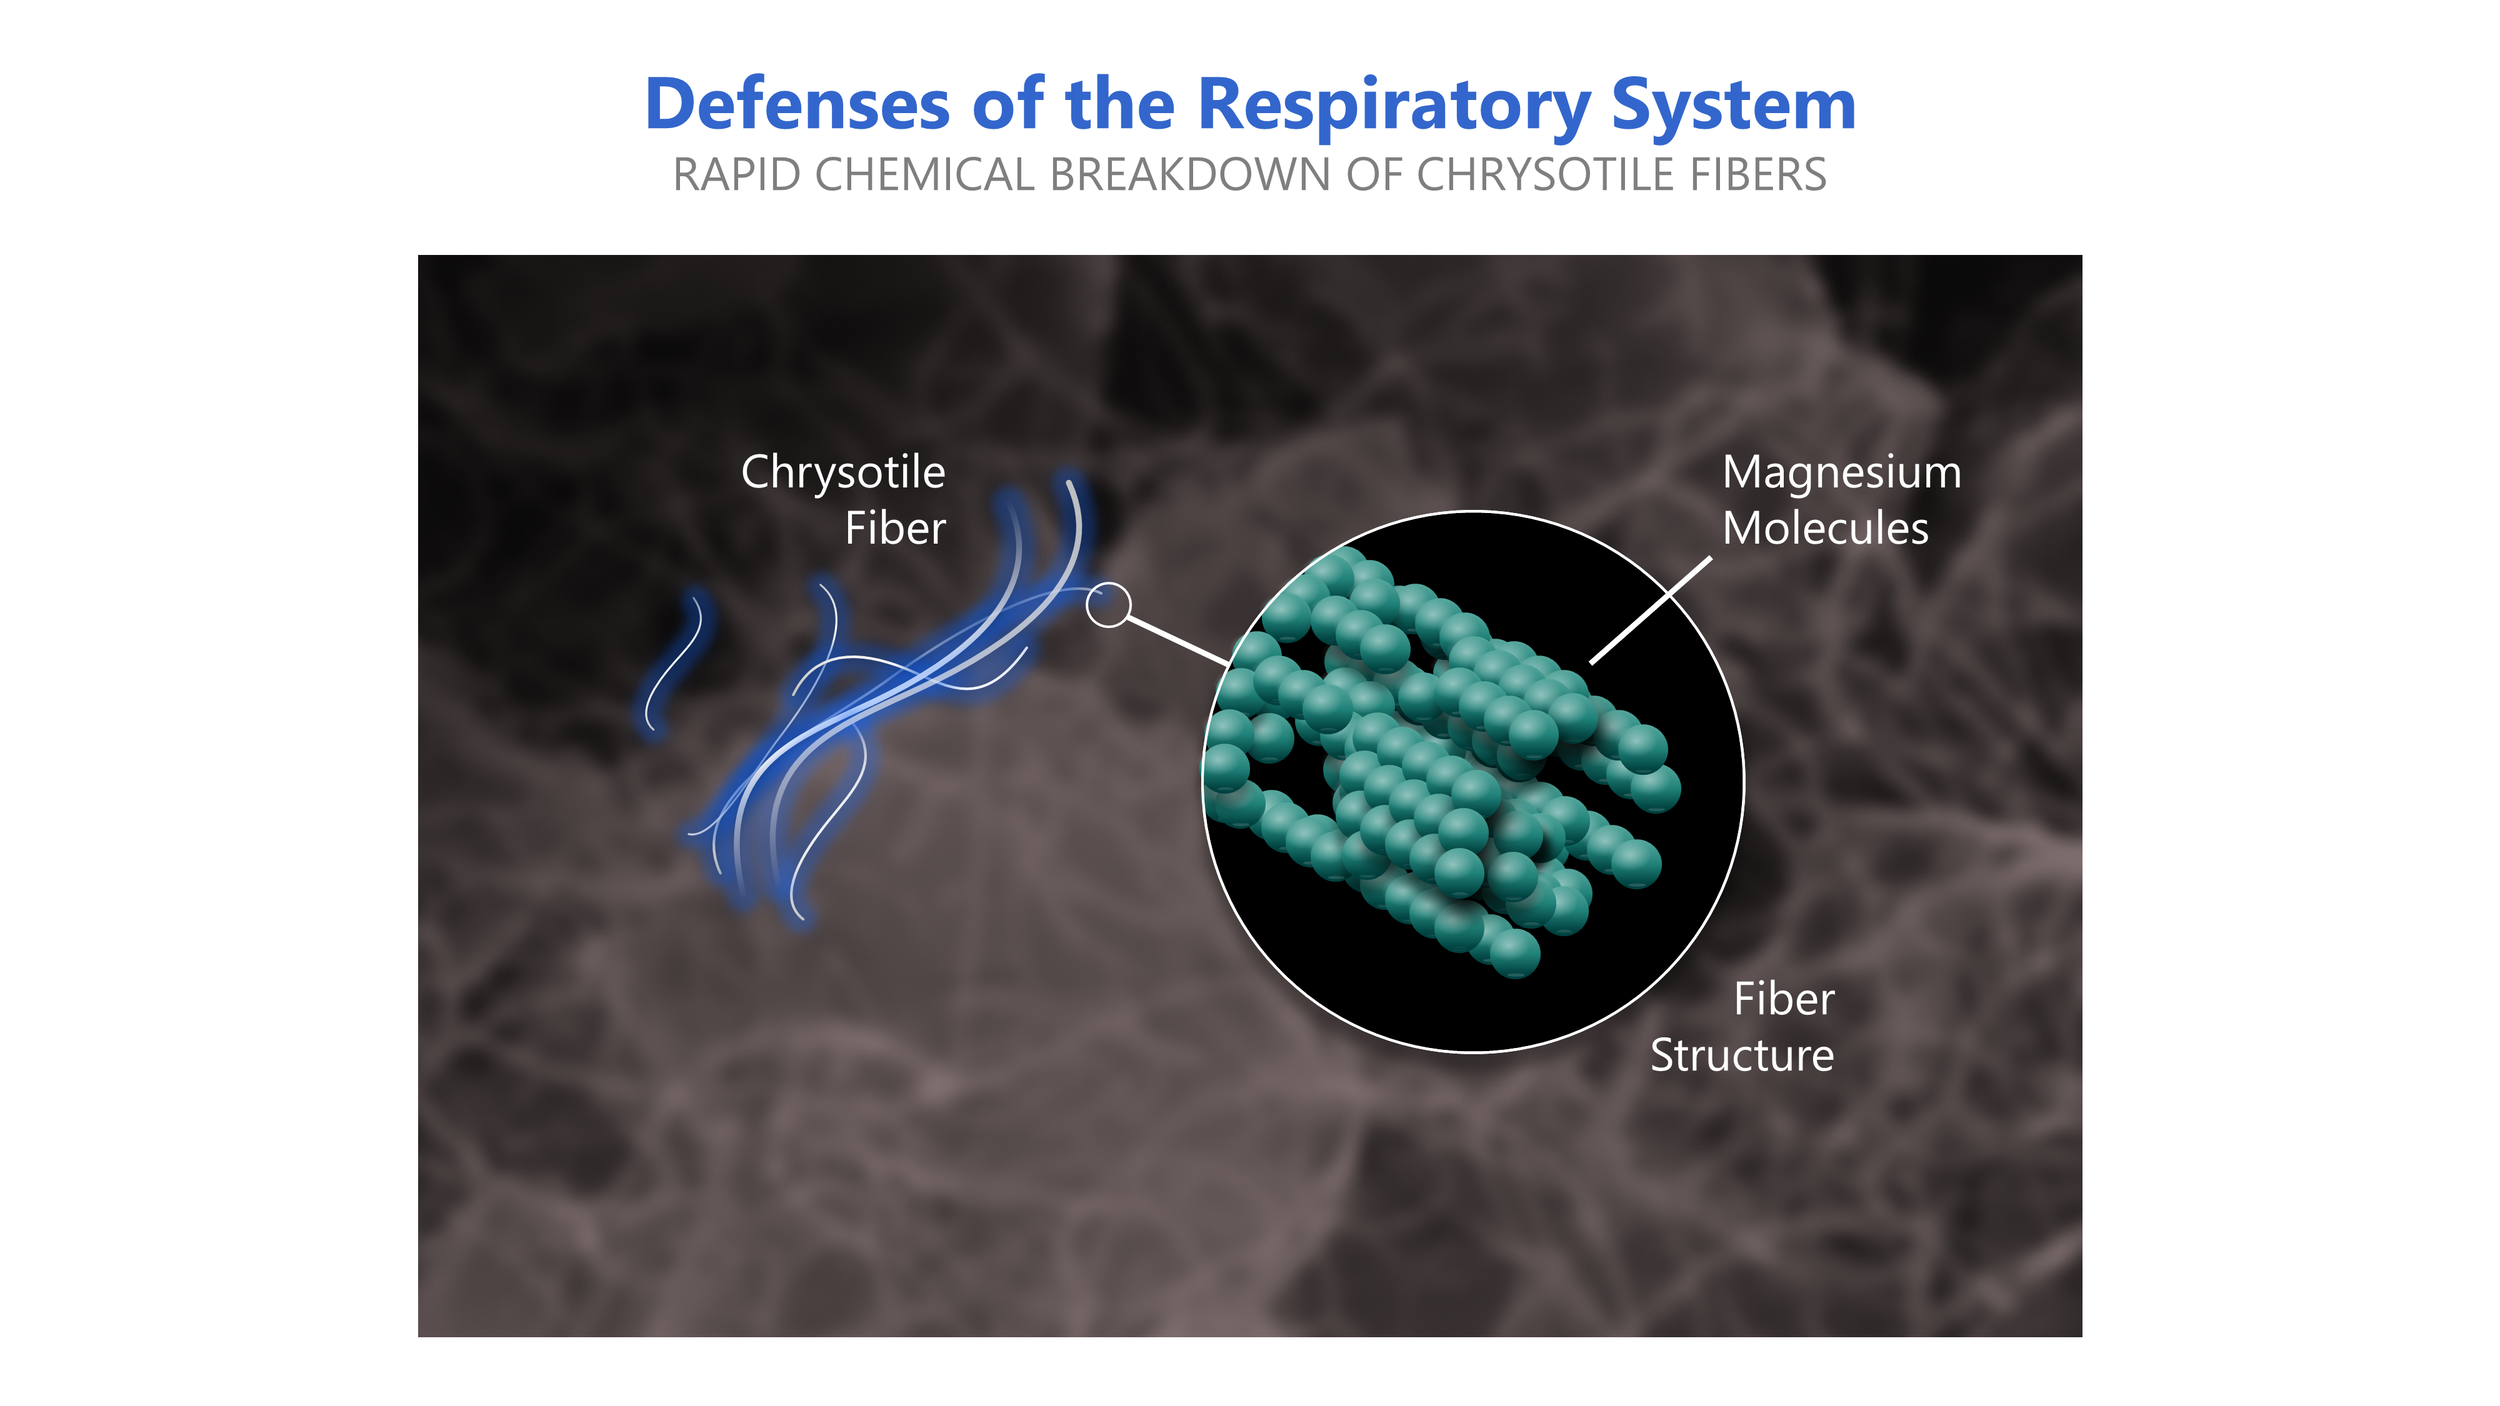
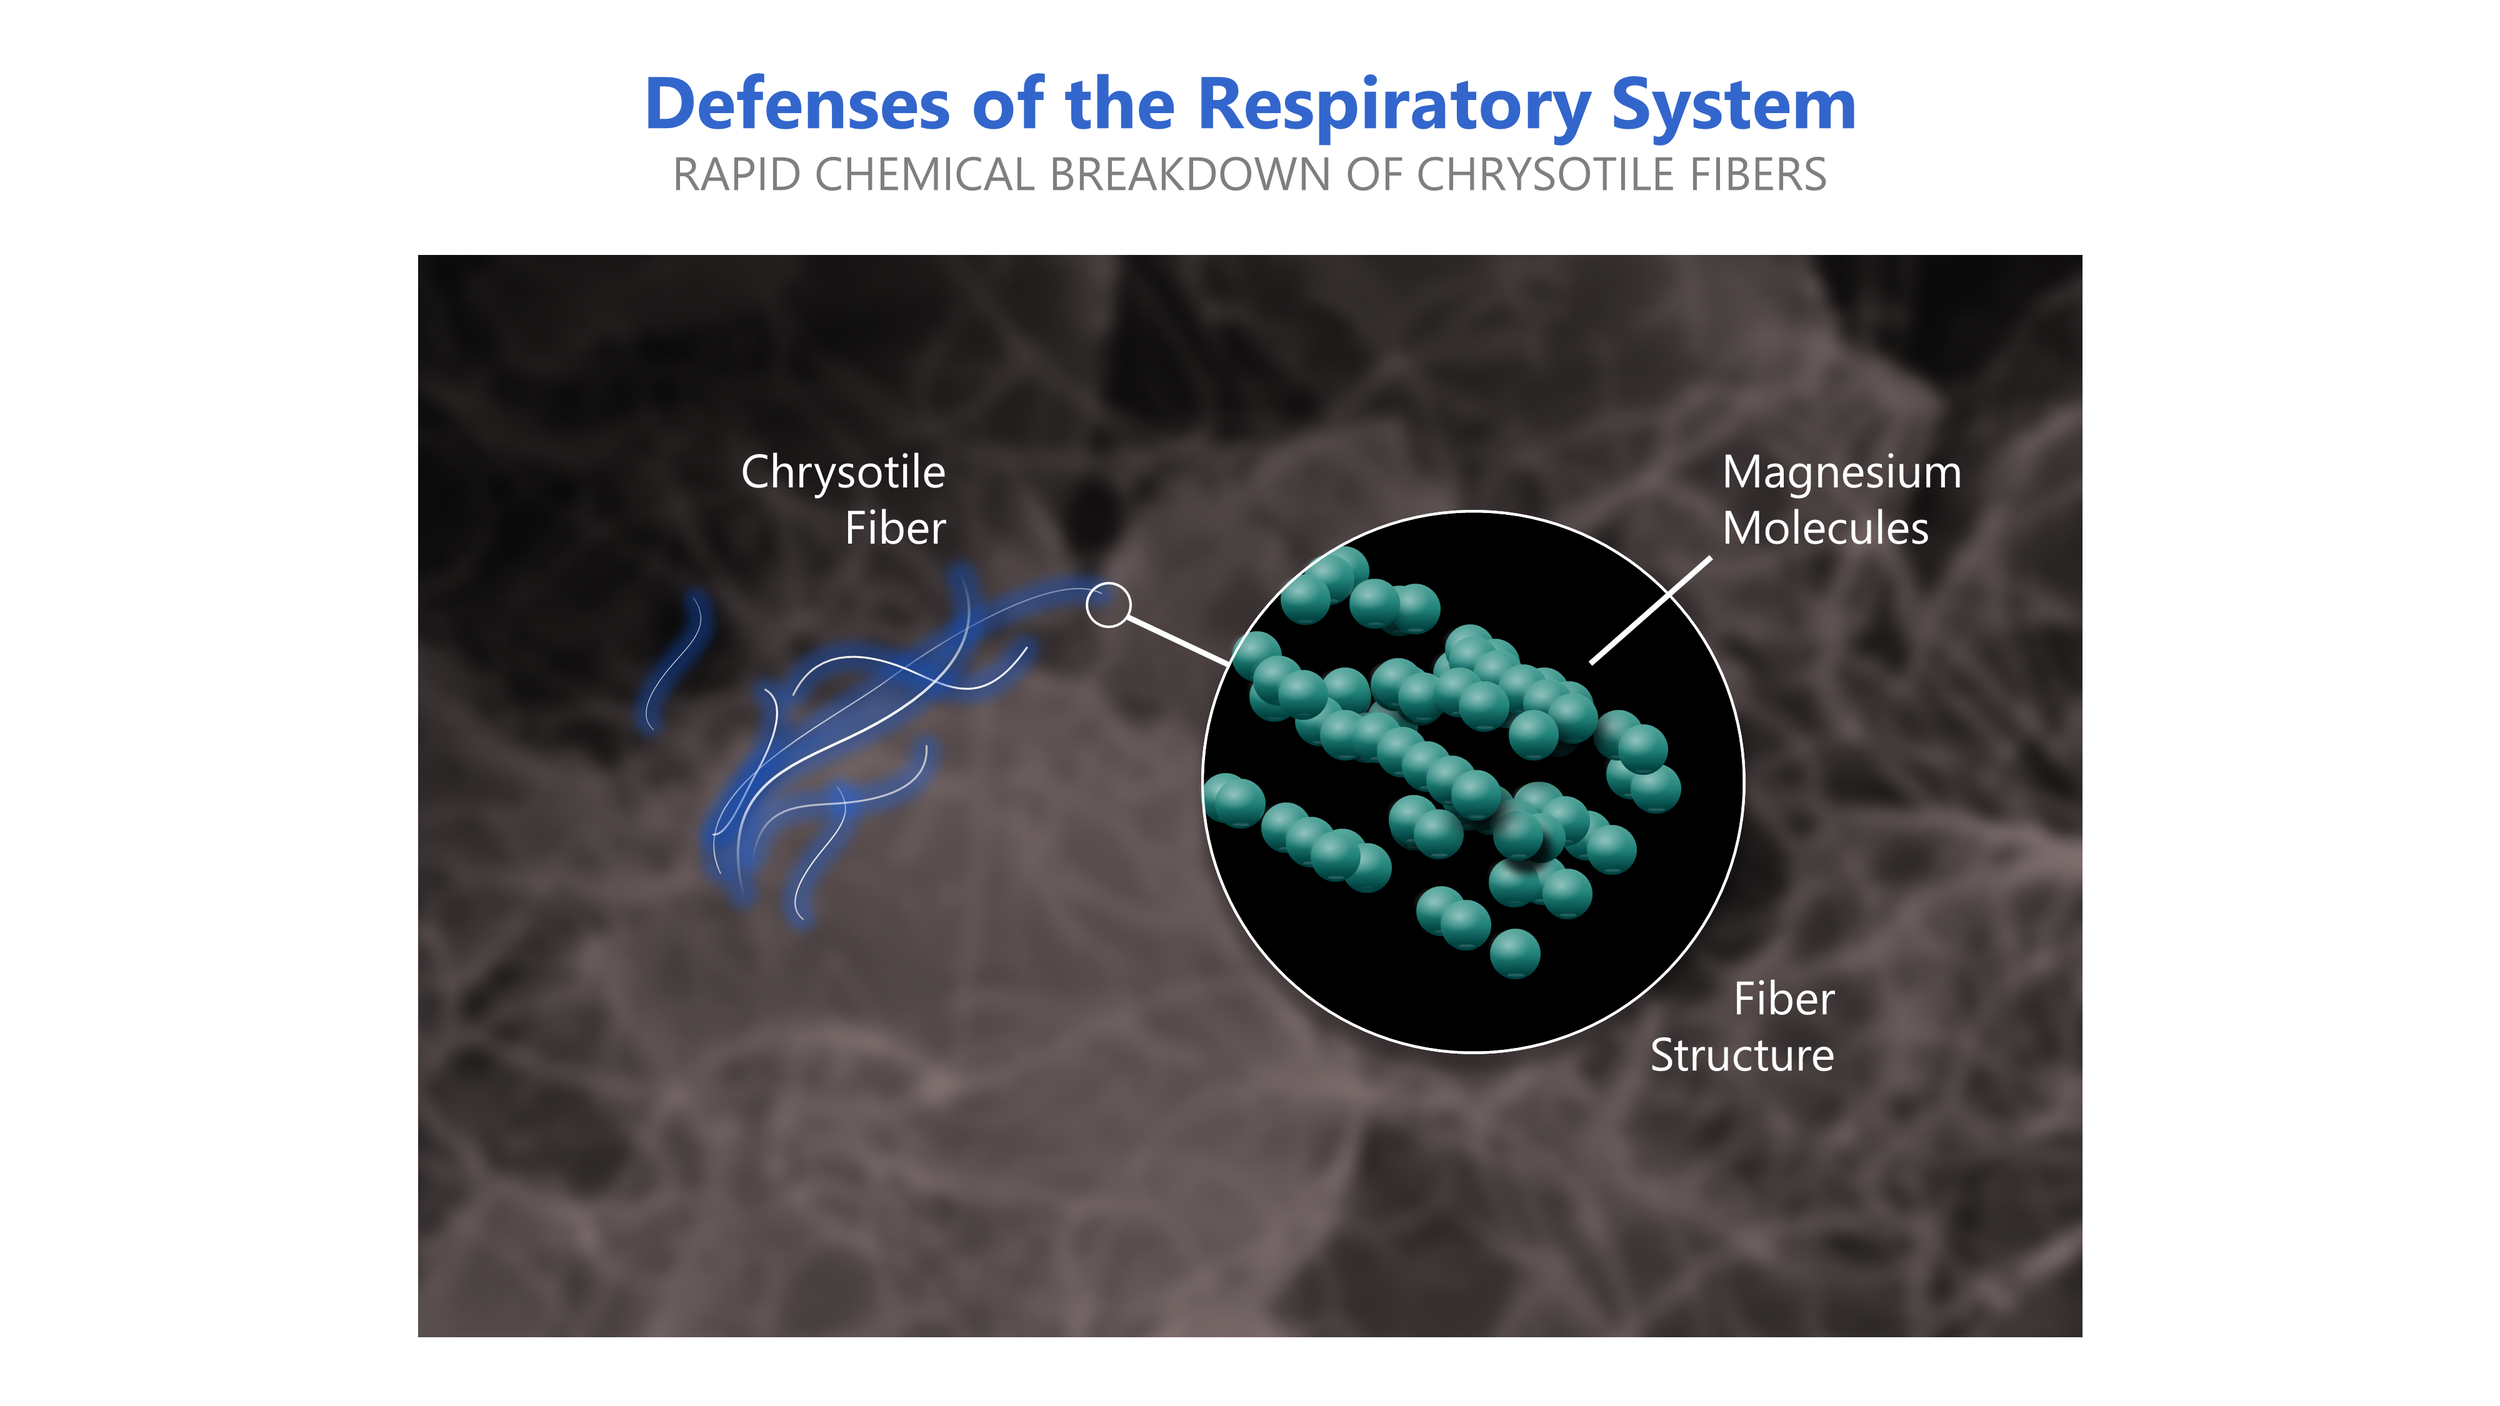
In the same matter, we continue with the simple models to show that a peak on the spectrum can show the presence of different chemical fragments that happen to share a particular mass.
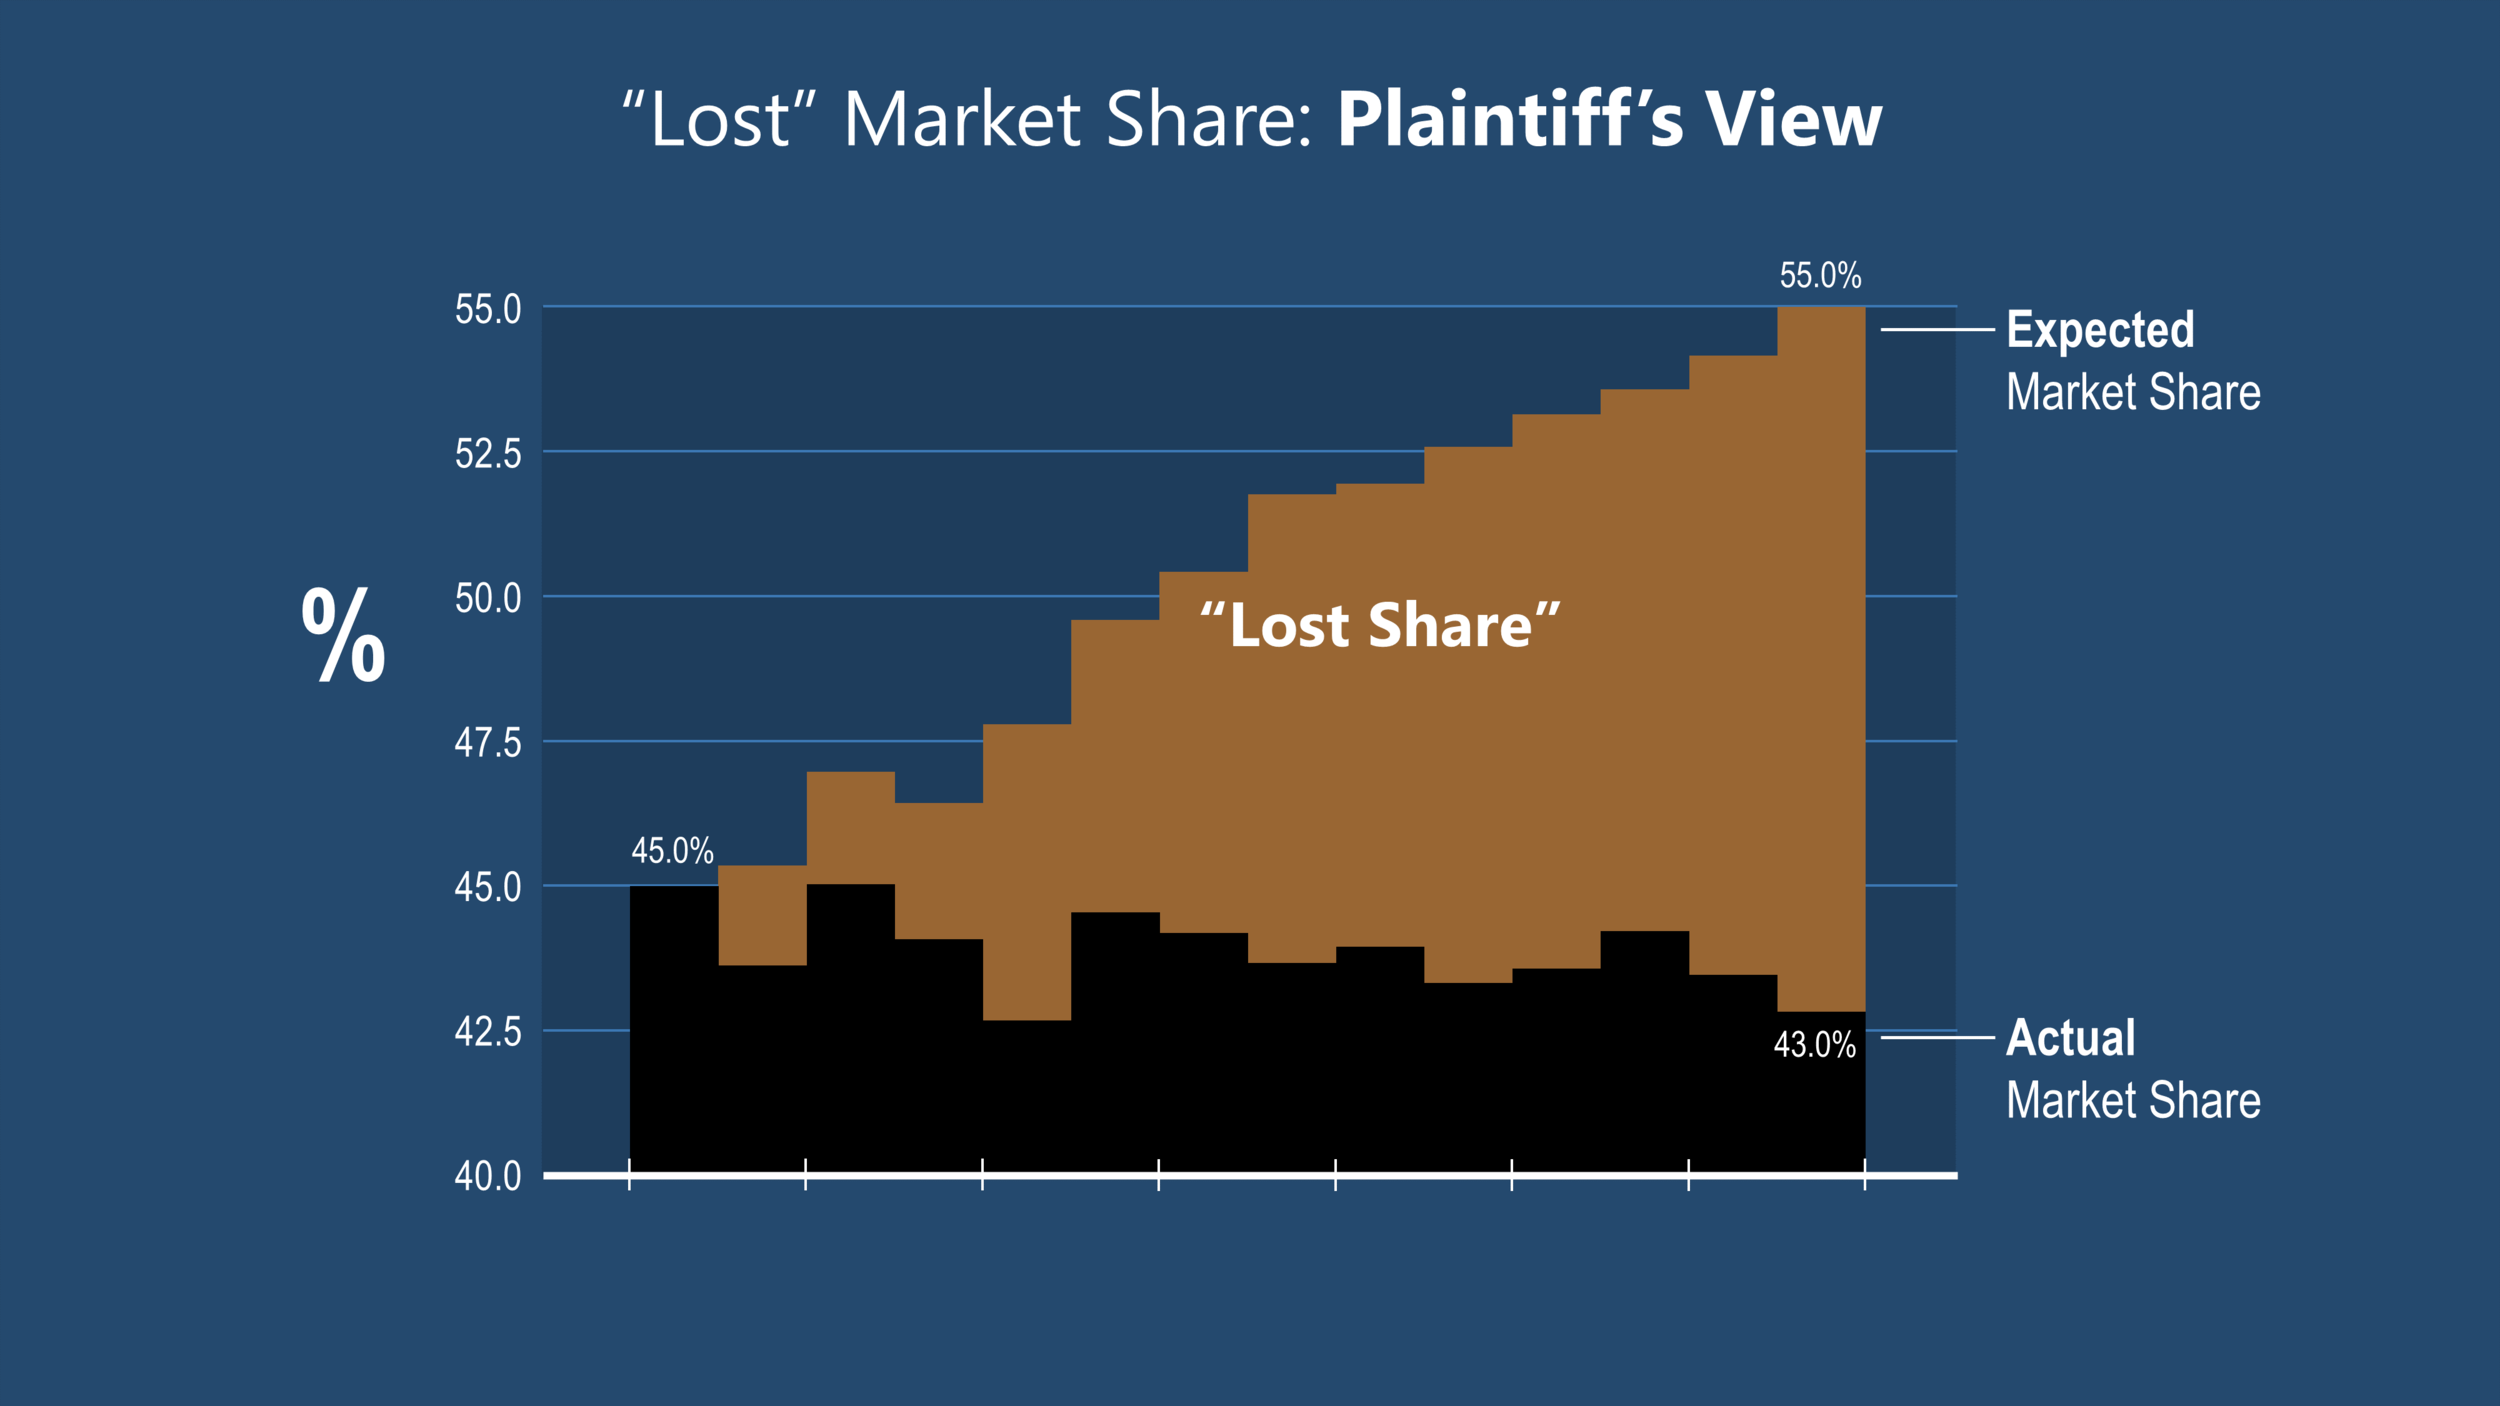
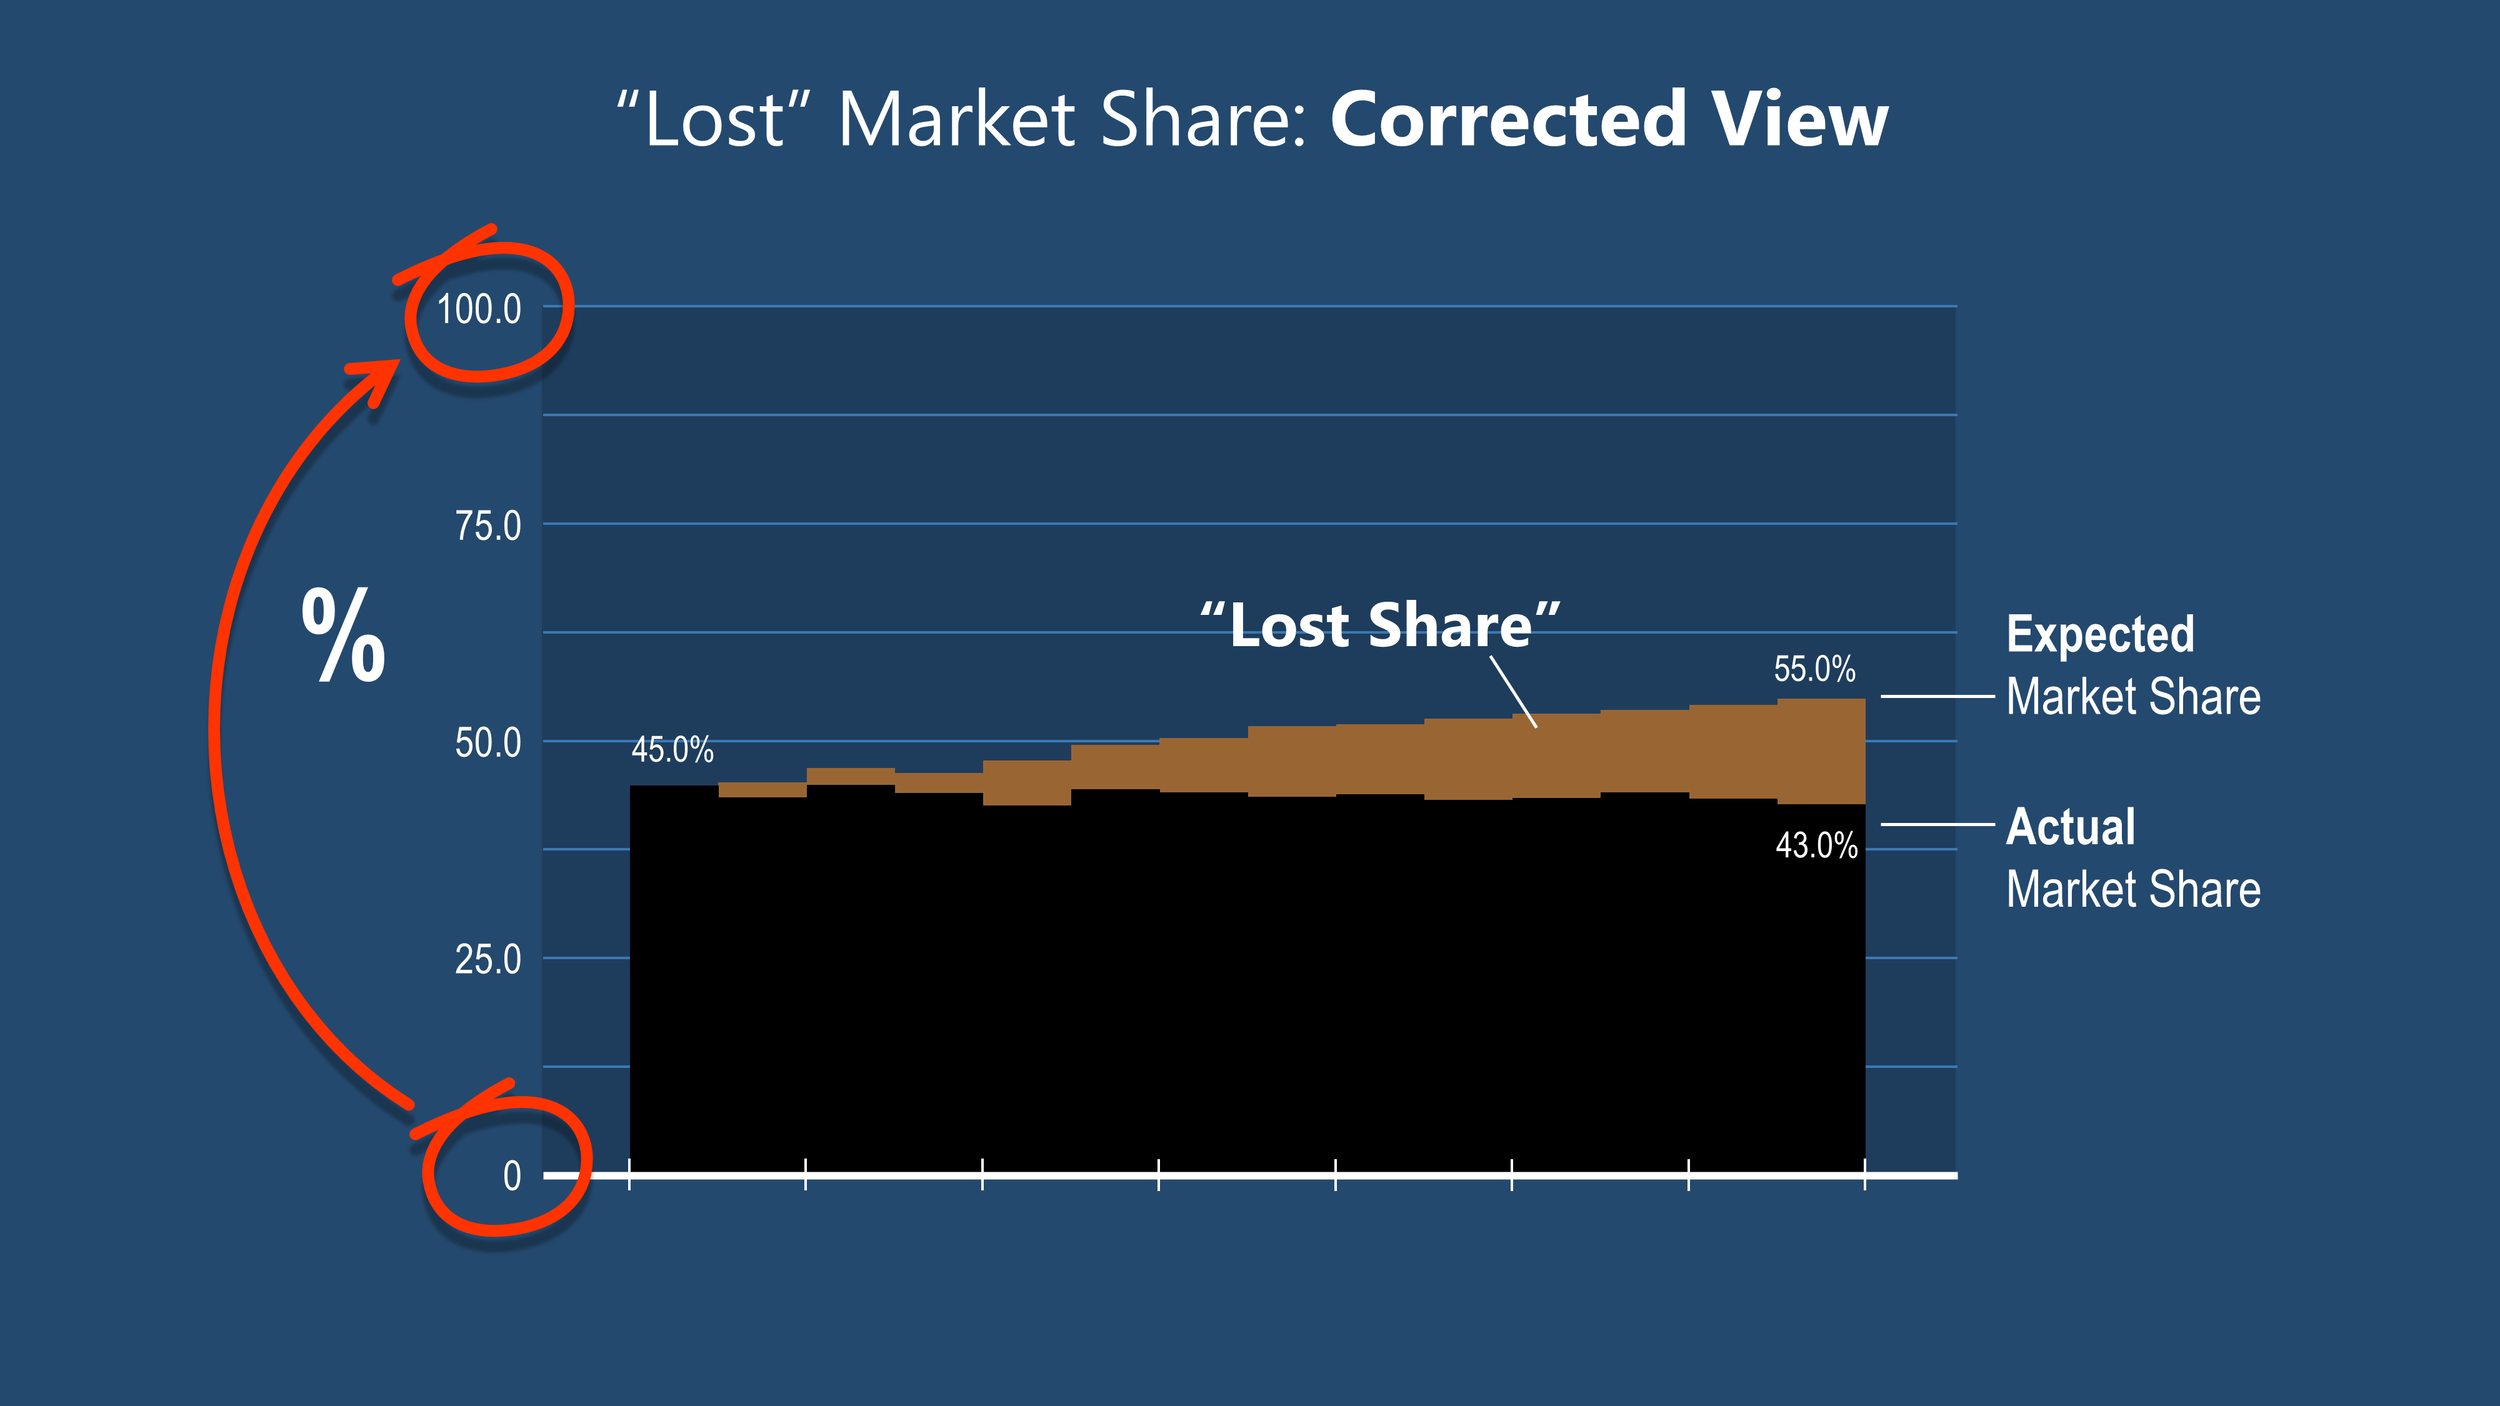
Whether by mistake or in an attempt to deliberately mislead, a plaintiff’s damages expert used a graph like this to show a seemingly huge “lost” market share. This creates an opportunity for the defendant to correct the y-axis limits, show a more accurate treatment of the data, then challenge the witness on cross.
What qualities make your graphics look good?
There is a wide range of style and philosophy in the world of “good” trial demonstratives. Some properties that distinguish the good are set forth below, and please note that some may overlap or even cancel each other out:
Accountability: A good graphic does not have cognitive barriers—that is, content or features that require probing thought from the observer to understand. At least some part of the mission of the piece should be instantly recognizable.

With progressive disclosure (building on screen) this 2D animated illustration demonstrates visual and data richness, while remaining accessible—that is—easy for the lay person to quickly comprehend
Visual Richness: This is a form of useful complexity that makes images more relatable and more memorable (see box on Park, et al.). Richness includes details and textures that reward deeper inspection, and which create a deeper impression.
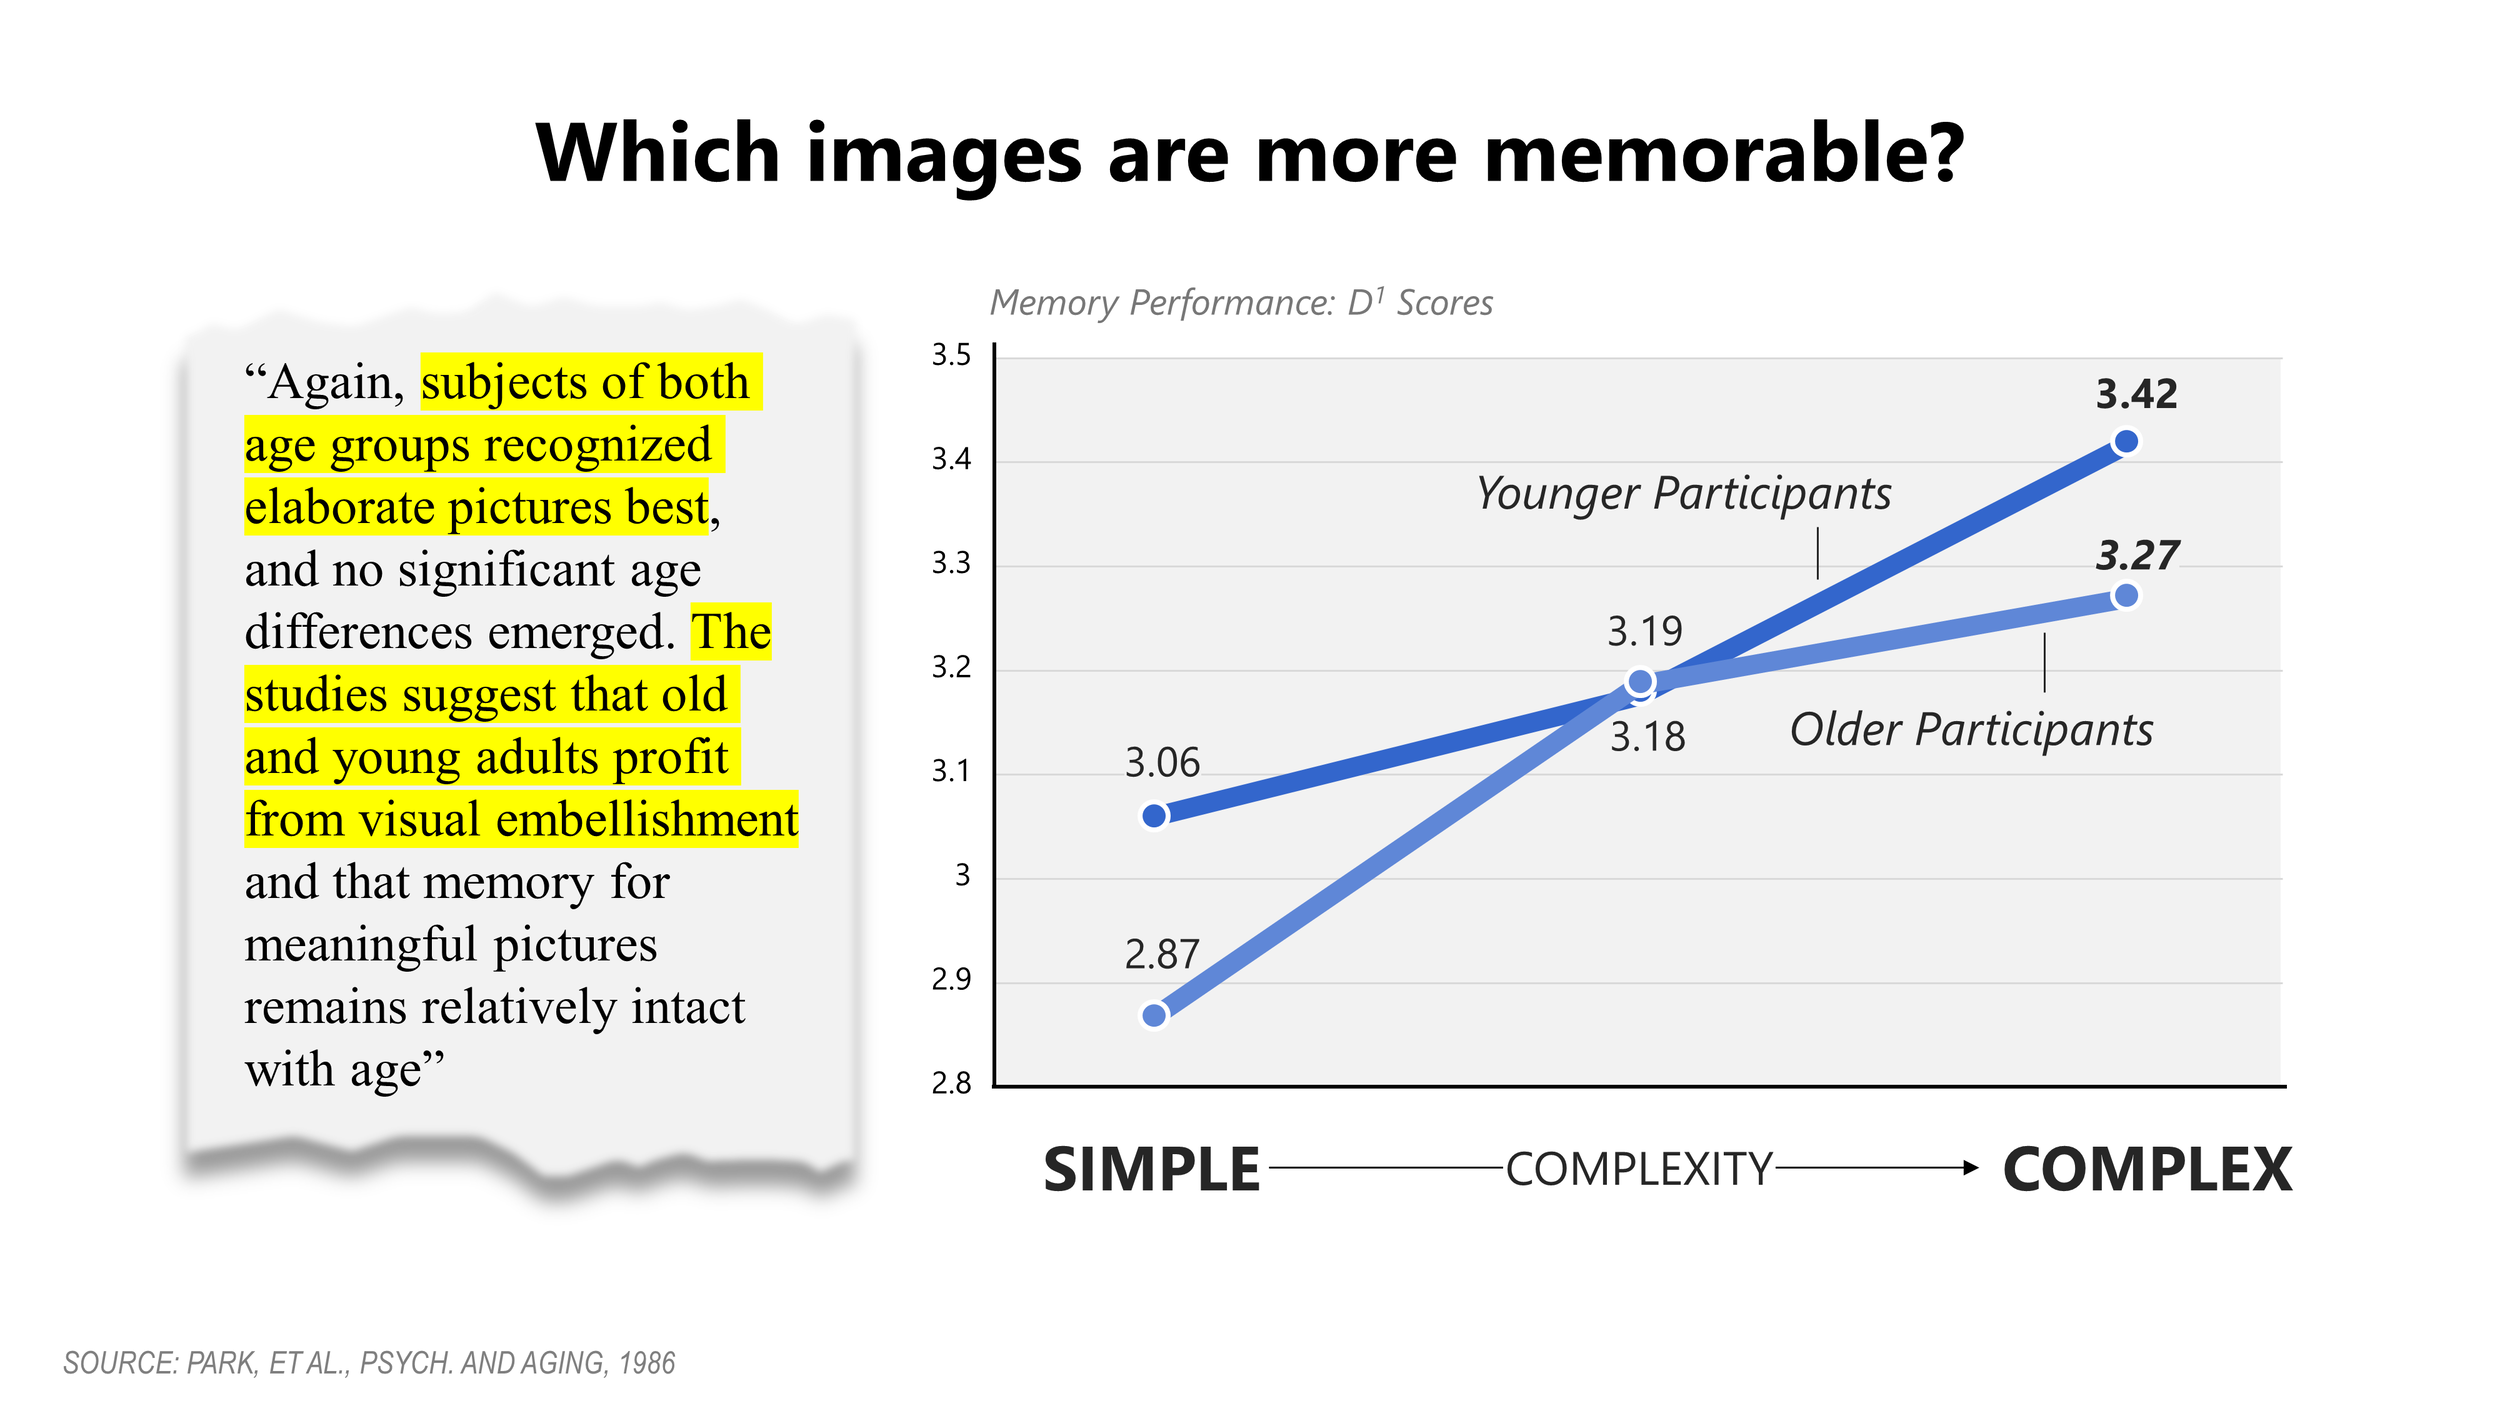
The findings of Park, et al in the 1980s supports my notion that less is not always more—and that jurors both recognize and remember information better when you show them a richer picture.
Data Richness: A Tufte principle, data rich images have lots of information arranged in a way that remains accessible while showing a level of complexity. Data richness includes the “indicia of authenticity” mentioned above, and those images communicate clearly that the author/artist has done their homework.
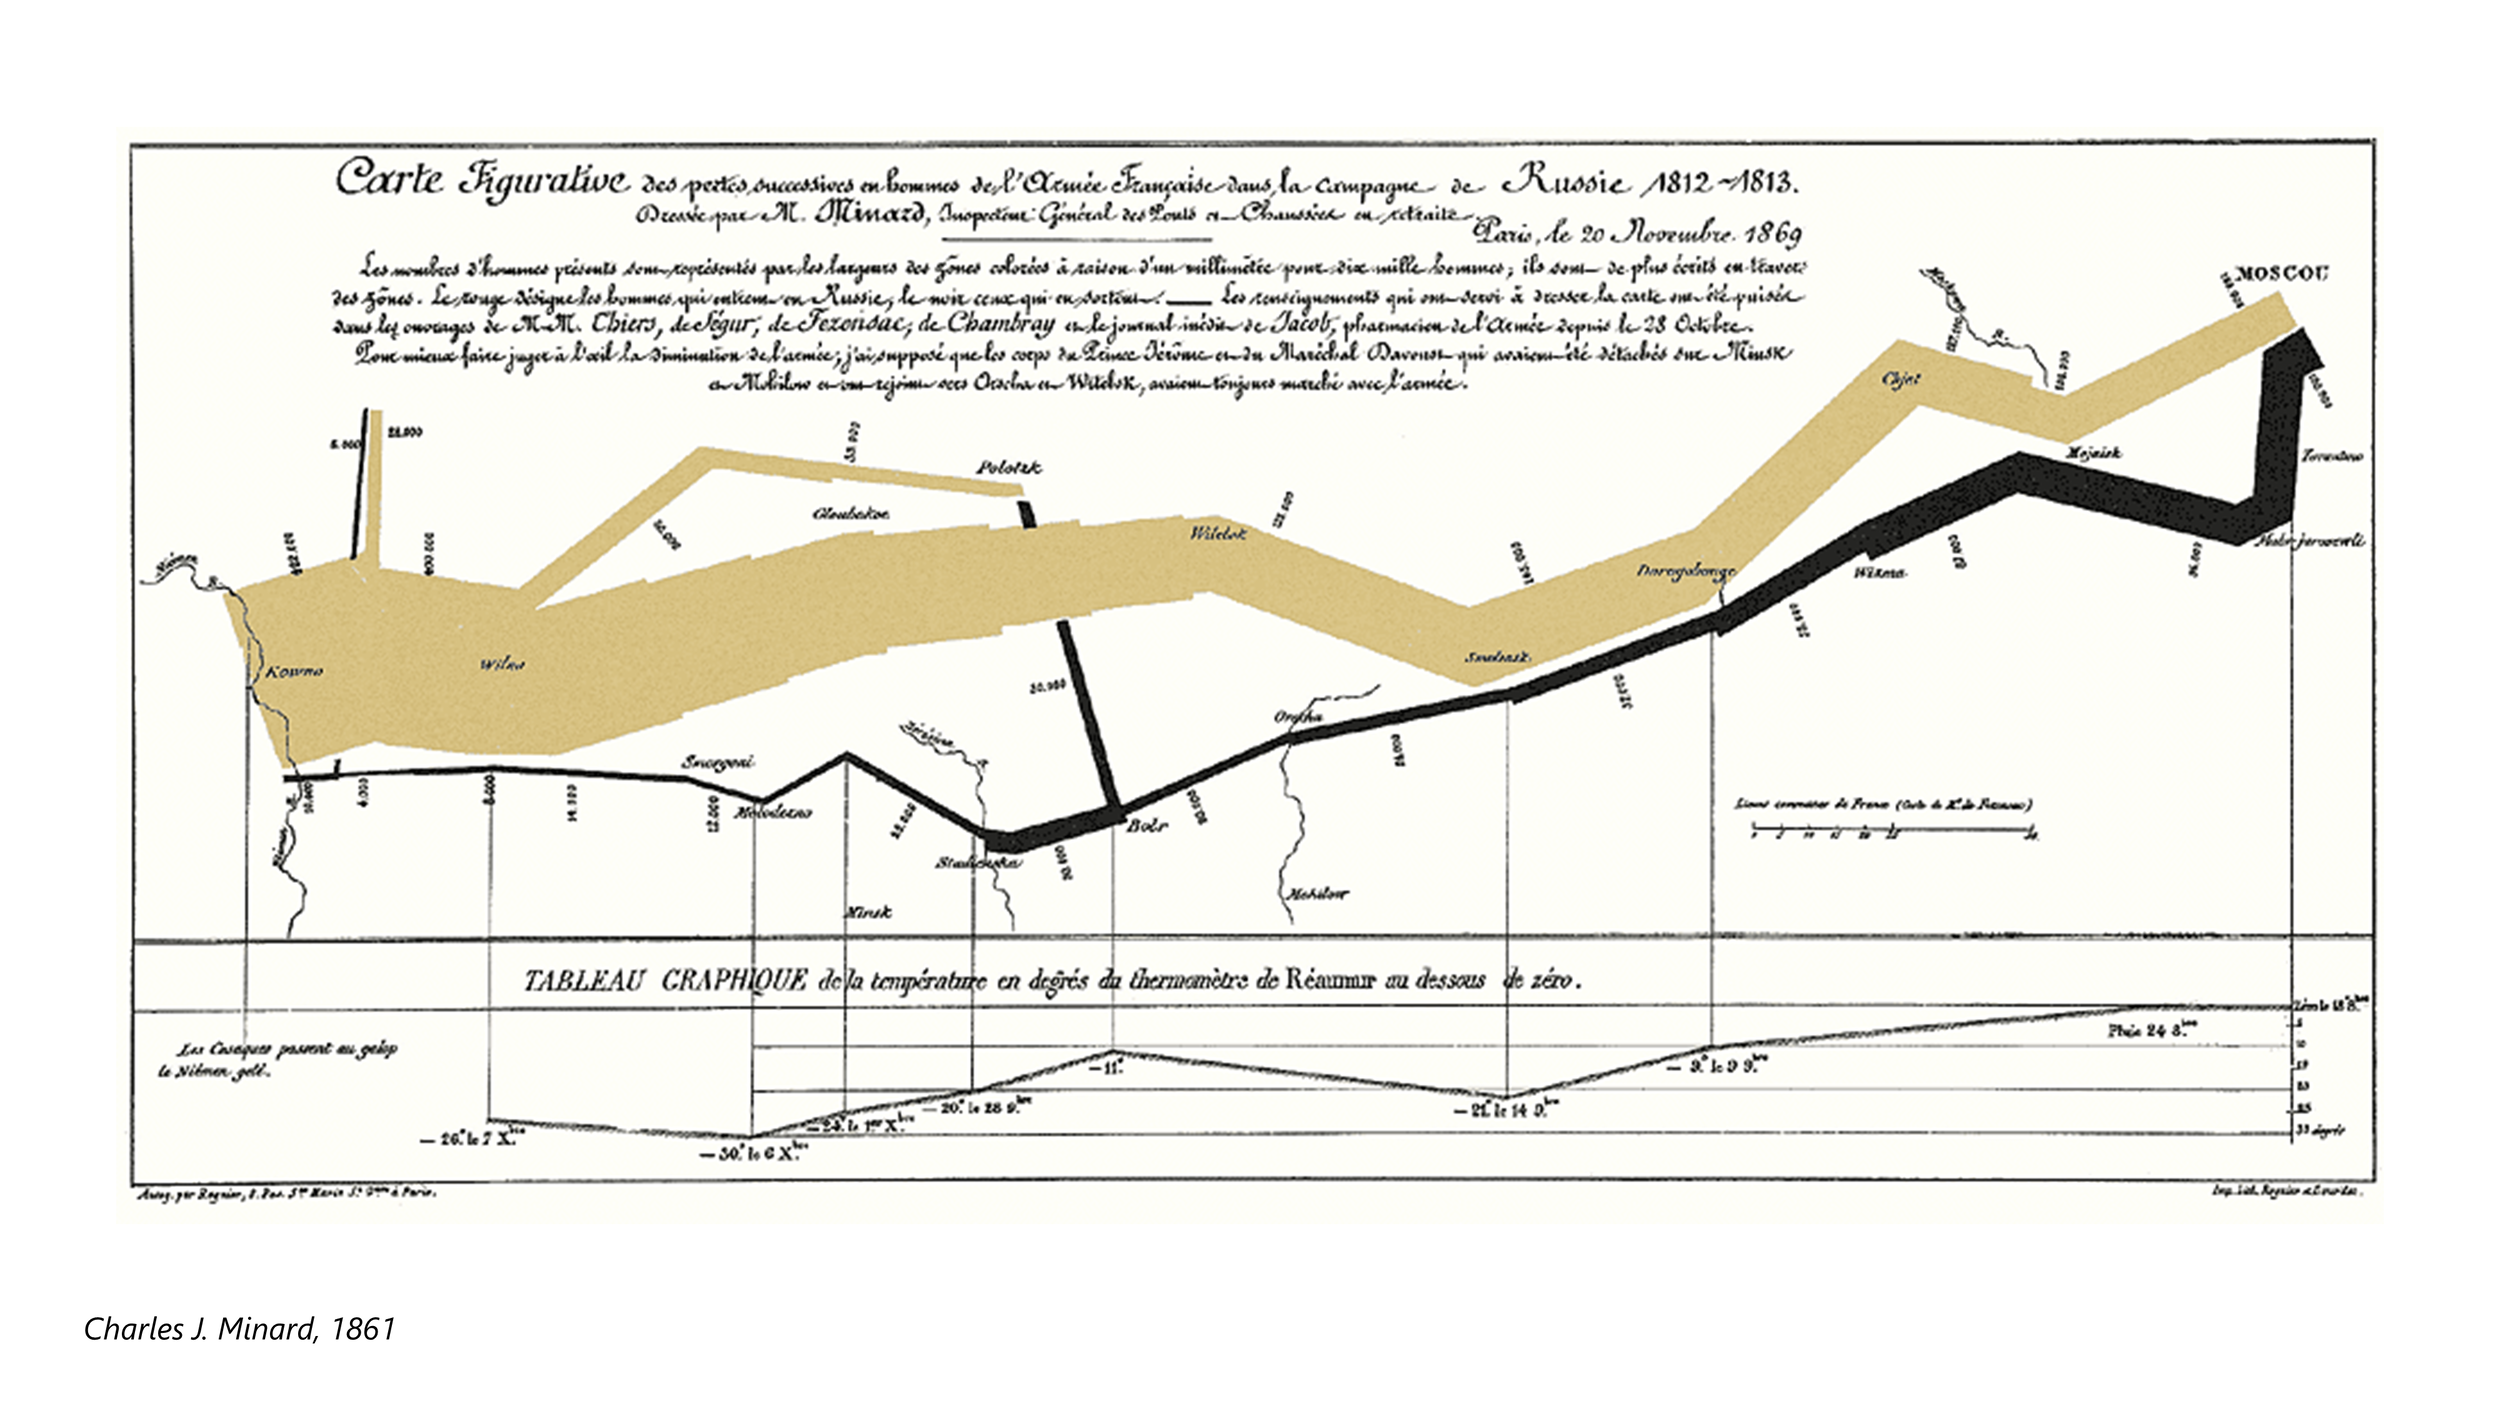
Minard’s 1861 diagram of Napoleon’s Russia campaign has been hailed by Edward Tufte as “the best statistical graphic ever drawn.” It offers a bold, instantly recognizable message (the decimation of Napoleon’s army) along with an engrossing set of detailed information, including time, location, direction and temperature—a great example of visual and data richness
Alignment: A good graphic is in alignment with trial themes and goes directly at proving trial objectives. Even neutral tutorial demonstratives should address content from the point of view of your positions. It generally is not subtle, and does not land glancing blows.

Animated 2D illustrations offer an attractive and economical approach to teaching persuasively. Graphics like this that are built in PowerPoint remain editable right up to the moment of presentation in court. This is a huge advantage with no penalty in viewer experience.
Illustration: Good graphics include professional illustration. Even a worn analogy can take on a degree of authority when rendered in a clean, academic style. Illustrations leave out things you don’t want to show and enhance those you want to emphasize. Don’t use clip-art.
Analogies pose challenges and opportunities. As a general rule, I suggest staying with a simple concept, and not “torturing” it, as there is always a breaking point. Visually, stay away from a cartoonish look, and keep it more academic or technical-looking.
Verbal content: A good graphic agrees with what you’re saying, and uses brief, memorable headlines, quotes and labeling. Progressive disclosure with mouse-clicks keeps everyone on the same page, but nobody likes big slides full of bullet points.

The verbal content of your graphics is important, and must not be overlooked. Building on mouse-clicks, titles, labeling and legends adds meaning for your audience, and effectively provides cue cards for you and your witness.
Fits presenter style: This is the number one indicator of “goodness.” The lawyer who really owns their graphics tends to present them in a way that works — and might just work for them alone. We have clients who are visual “Calvinists” — they eschew every design element, ornament or enhancement. Their demonstratives are completely plain (mostly black and white) — and they almost always win. And we have clients who push the envelope in the other direction, using lushly illustrated analogies and other elaborate devices — and they win just as often. Whatever place along the spectrum our client comes from, I endeavor to create good graphics that particularly fit that presenter’s style.
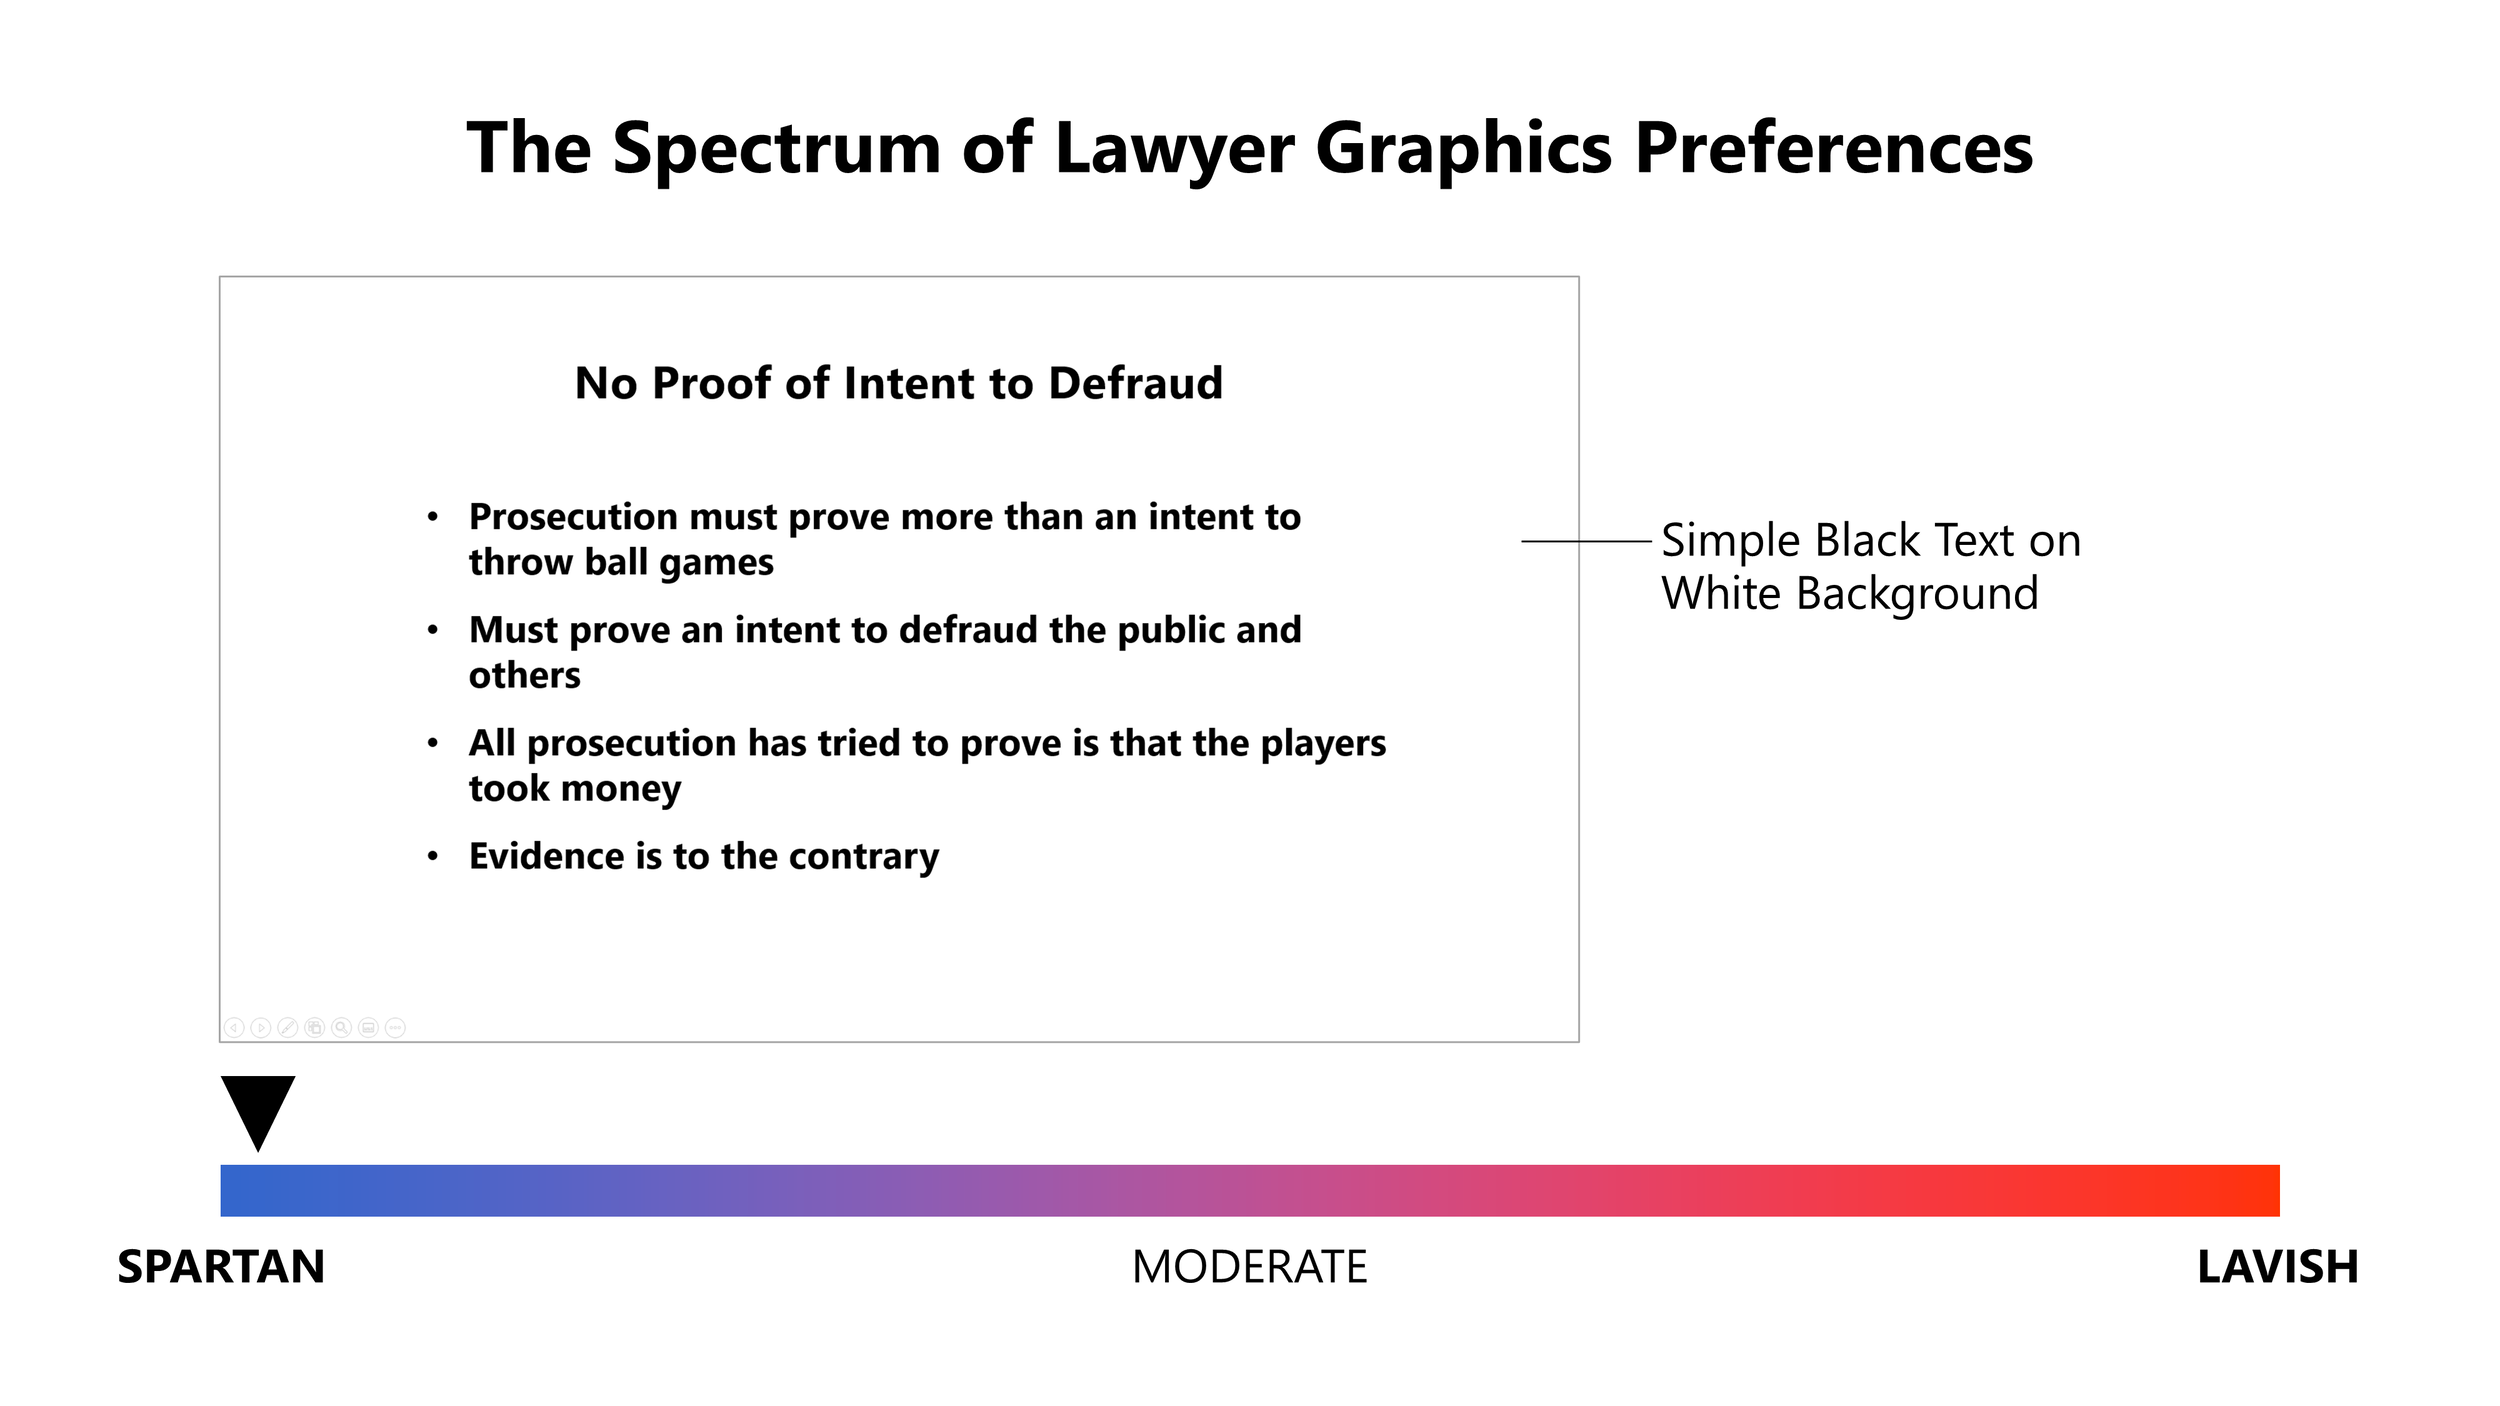
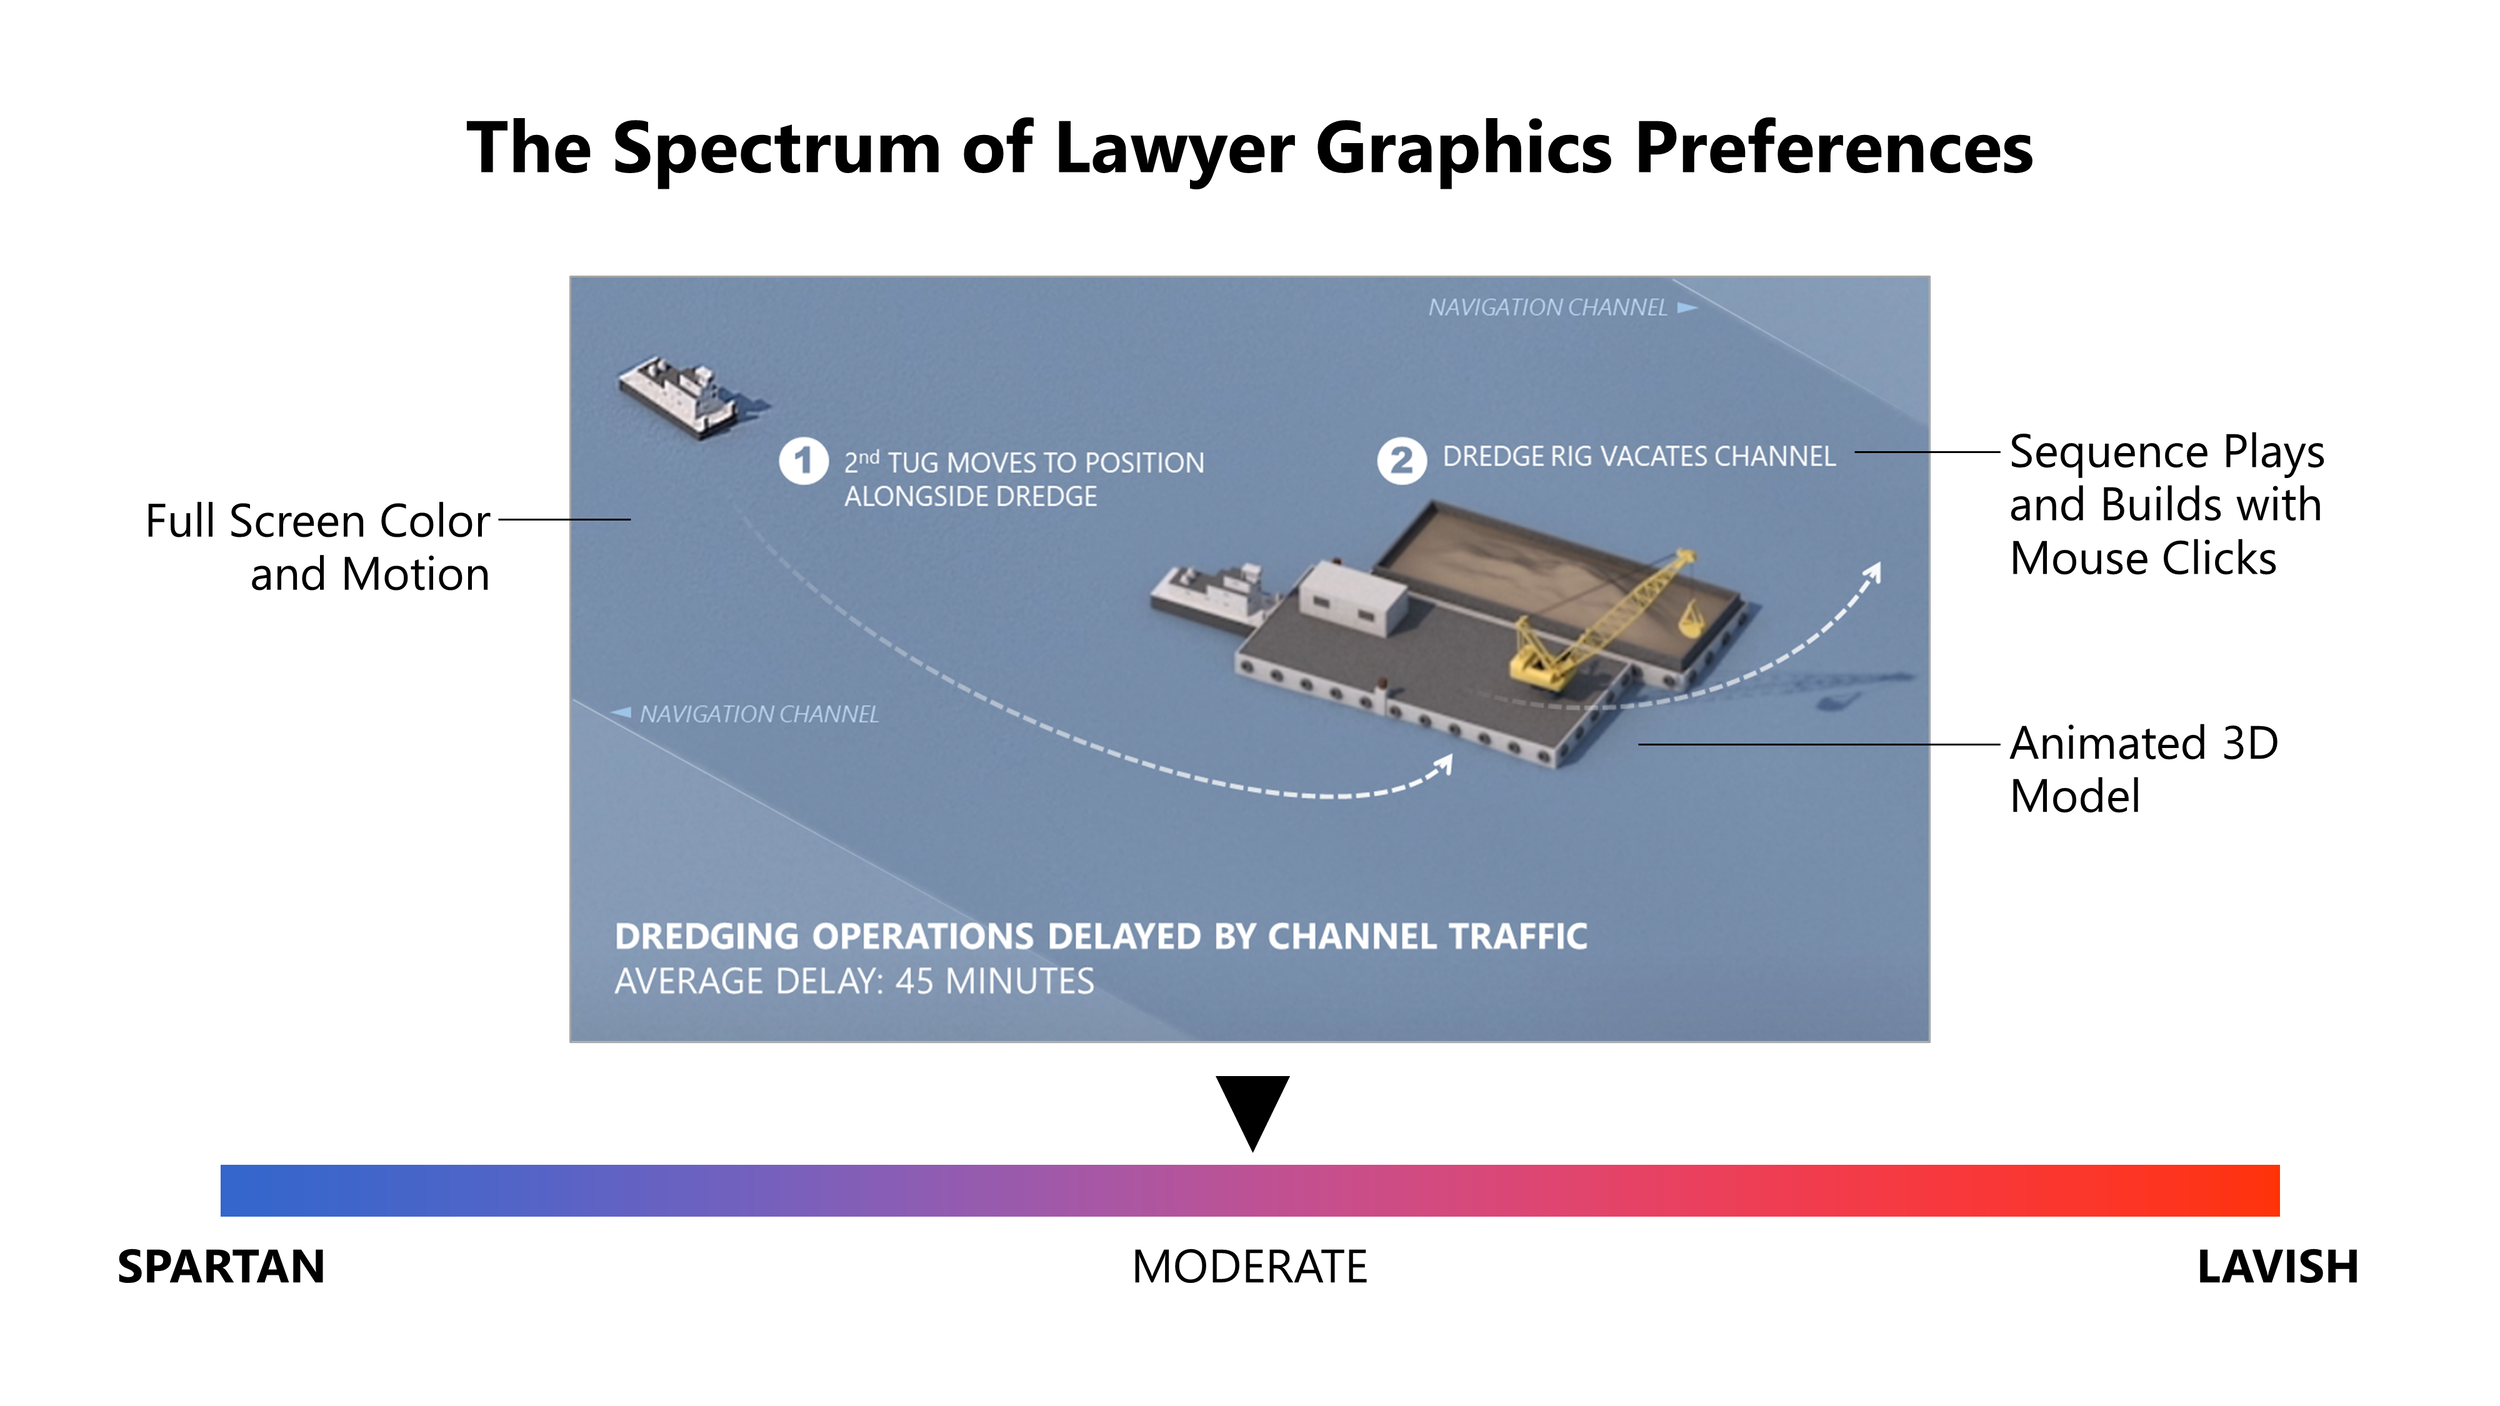
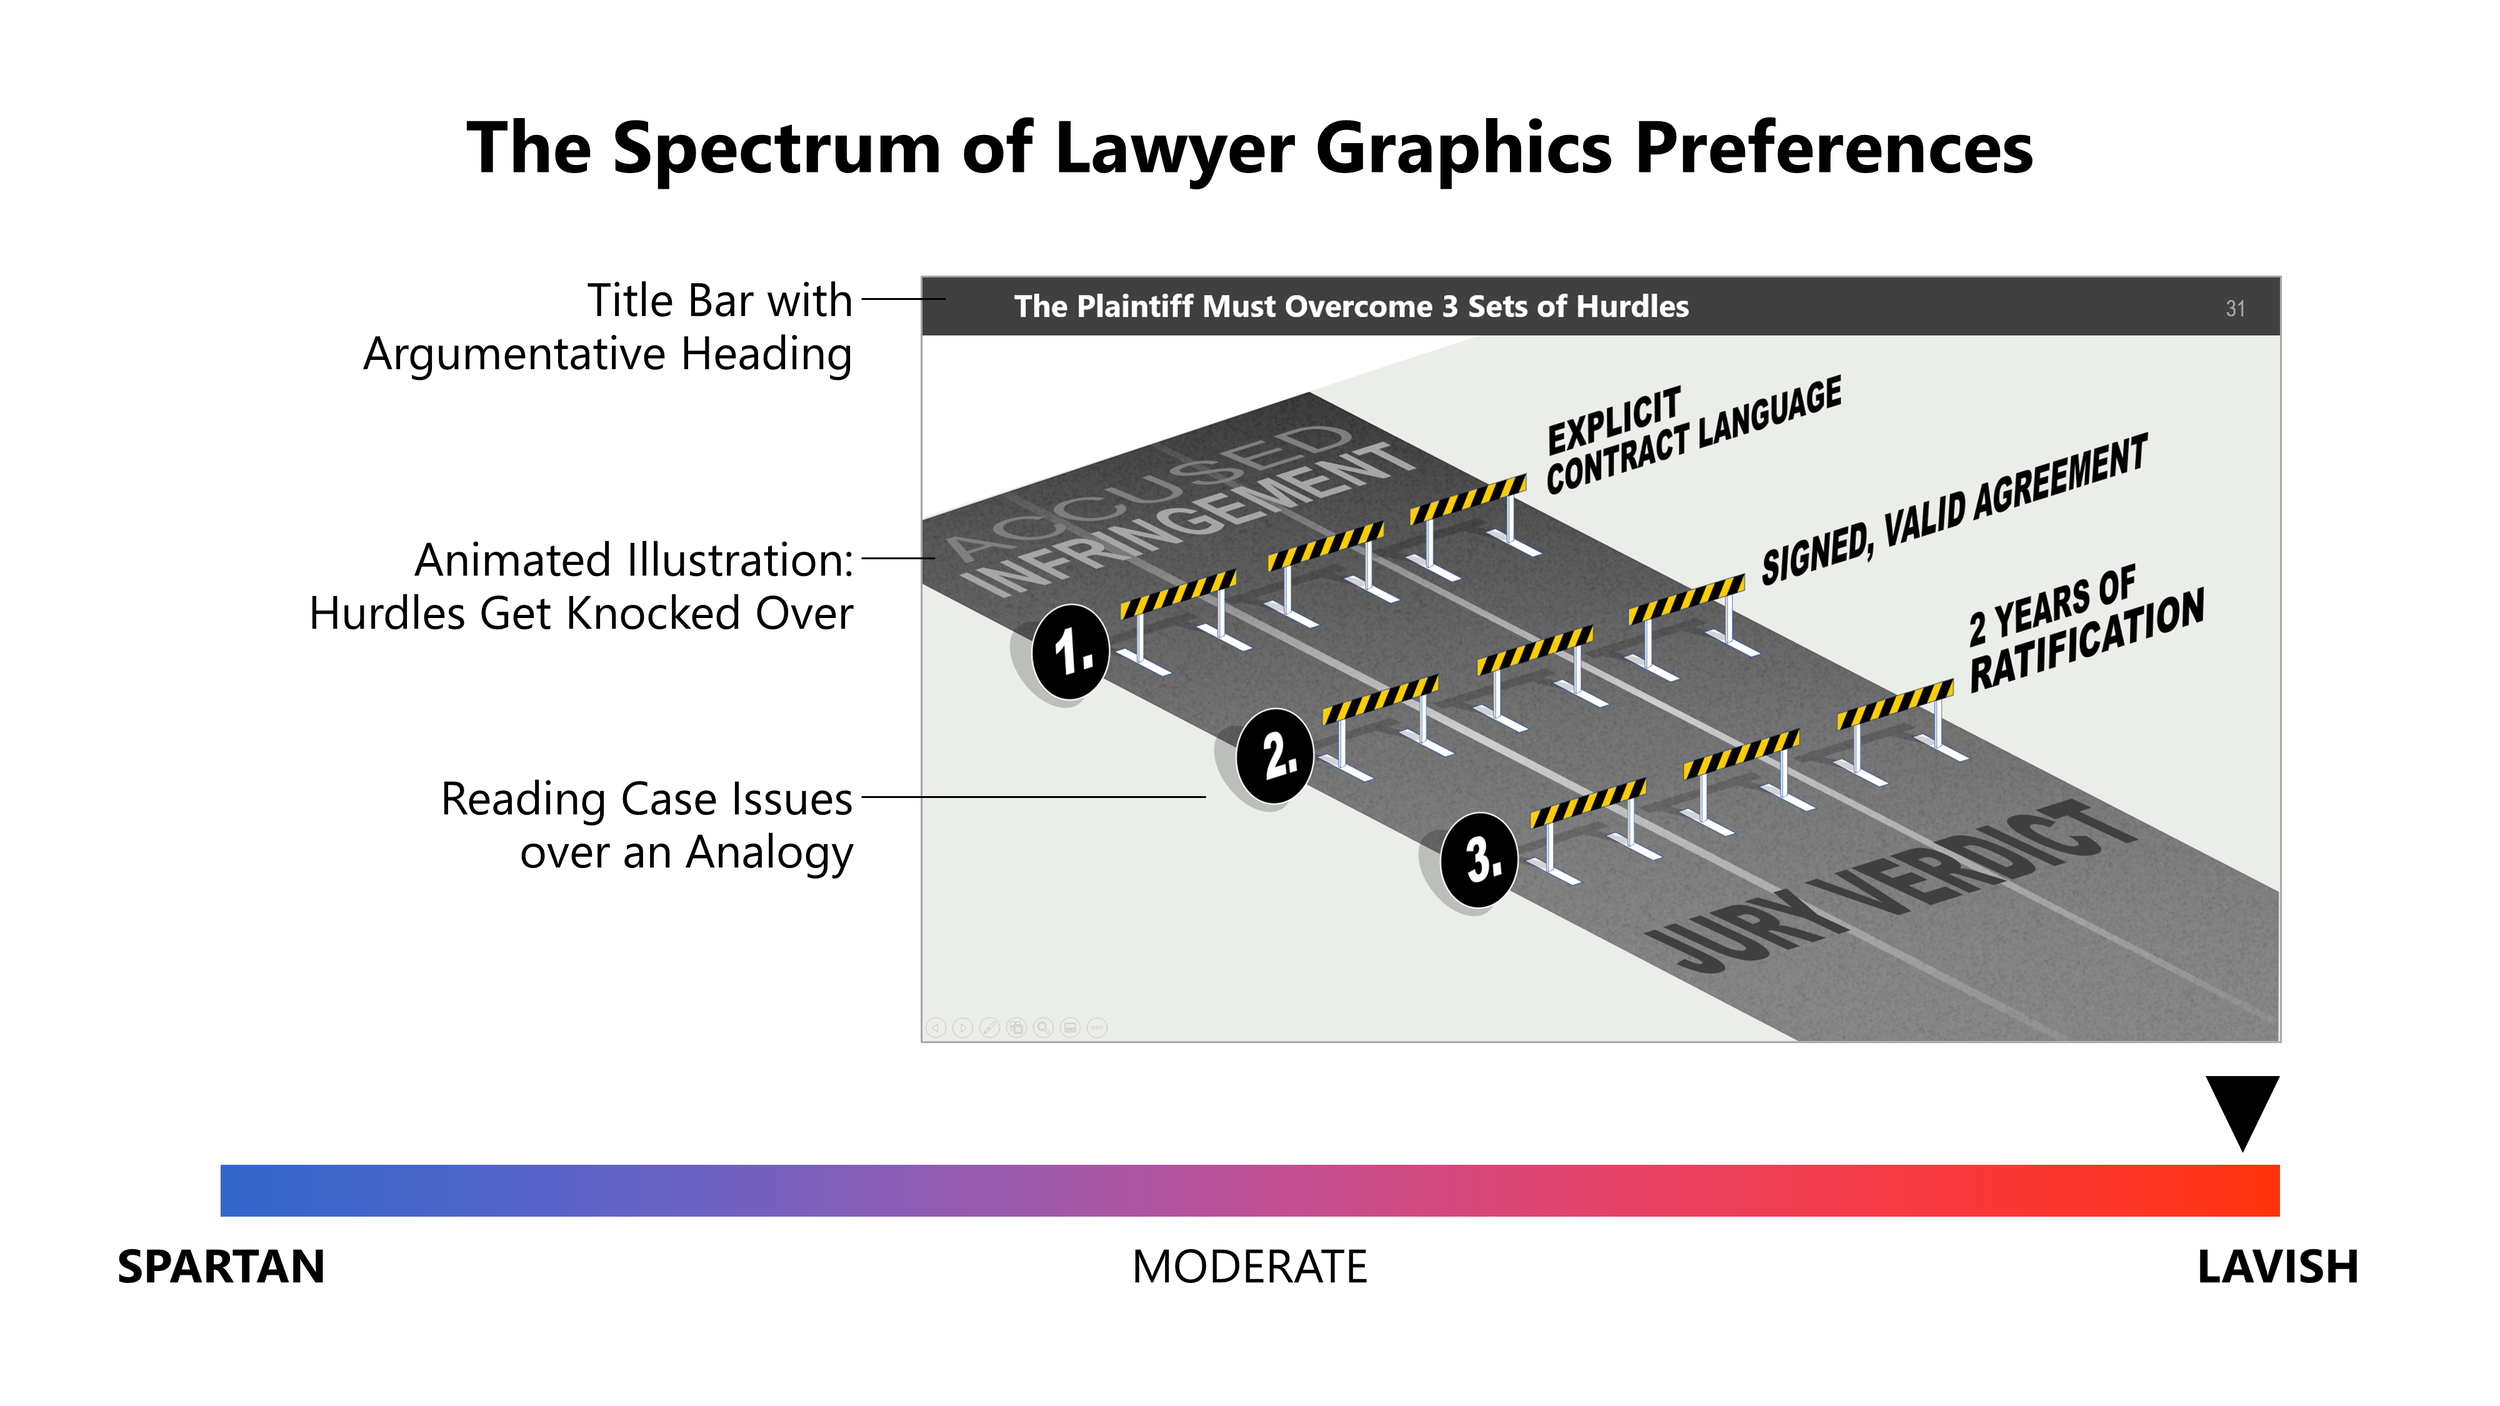
Some lawyers prefer plain graphics with no fancy formatting. Most occupy the middle ground, using illustrations, photos and animations with some color and neutral formatting. And some like to use more elaborate illustrations, animations and visual analogies. In my experience, when their graphics fit their styles, they are all right.
Our team specializes in developing graphics that capture complex issues and present them in a simple, clear way. Contact us to learn more about how we can help.