
A Gallery of Graphics
From Litigation
Accounting and Fraud Casework

▲Embezzlement example
This redacted scheme chart shows the net effect of a complex web of related-party transactions: the defendant partner transferred assets from the shared entity to his own books. And ultimately, to his actual possession.


▲Other account examples
On the left we show an animated ledger/timeline that tracks money on and off the books. With the animated flow chart at right, we allowed the judge to see the accused structure was an actual sale.
Antitrust Casework
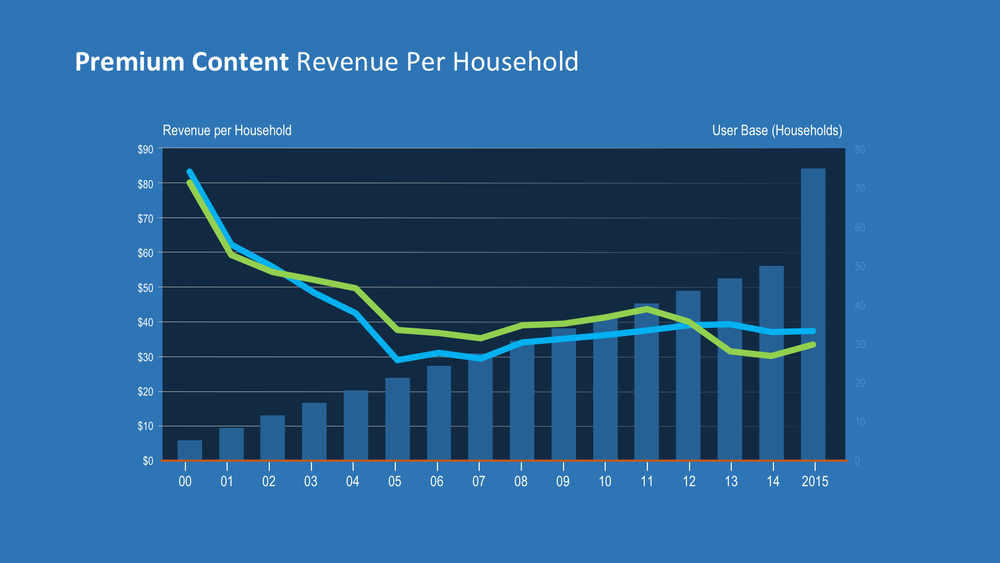
▲Monopoly pricing example
This (much disguised) graph shows that even as market share grew, pricing did not increase. Accordingly there was no “monopoly pricing” and consumers were not harmed. They in fact benefitted from low prices for premium content.


▲Other antitrust examples
On the left we used a simple diagram to simplify—and refute a complicated allegation. At right is typical of a tutorial to orient judge and jury to technology at issue in an antitrust case.
Breach of Contract

▲Service agreement example
This (much disguised) graph shows that the planned 3 major service “structures” didn’t get built, with the contractor implementing less than 1% of the requirement. Our client used the building analogy throughout briefing. This graphic allowed him to close (very successfully) with it in an arbitration hearing.

▲Other breach examples
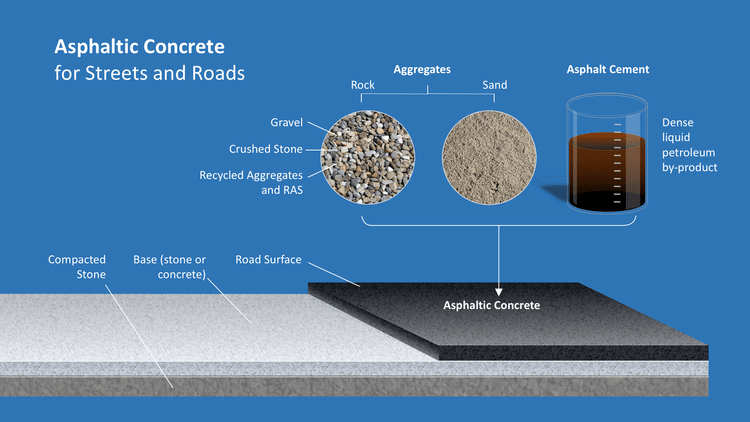
At left, the terms for paving materials were in dispute; In the example at right, an animated 3D model is used to explain events in a complicated contract and lease dispute.
Employment Defense Casework

▲Employment Discrimination Suit
This (much disguised) org chart was used to show that in the defendant organization, an accused manager did not have compensation review and decision-making authority over a plaintiff employee.


▲Other employment examples
Graph on left shows a defendant did not sell shares, rather built and held a large stake. On right, timeline shows shift in plaintiff’s account of a workplace disagreement after she filed suit.
Environmental Casework

▲Groundwater Contamination
This 3D model shows plaintiffs’ failure to detect claimed contamination escaping from a remediated site’s monitoring area. Evidence actually showed that the remediation effort was working perfectly.

▲Other environmental cases
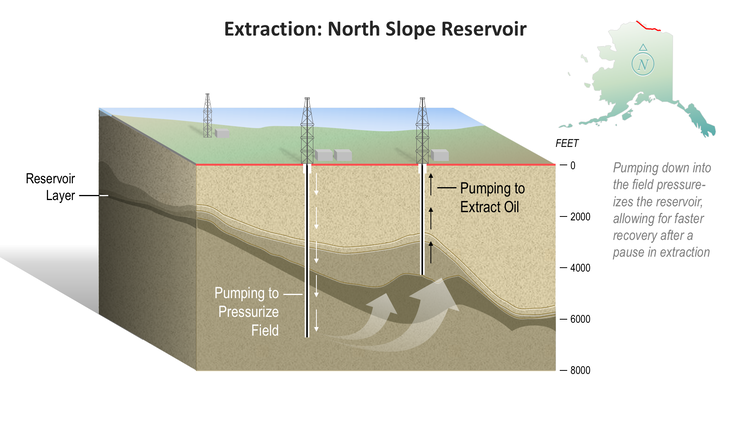
On the left, an animated 2D diagram shows how recharging a field speeds extraction after a pause. On the right, a graphic used in client briefing on the Deepwater Horizon disaster.
Insurance Coverage Casework

▲WTC Insurance coverage case
This (redacted) trial board was used in summation to prove to jurors that the WTC’s major reinsurer never switched from the standard form used by the property manager. This meant that the attack was, by definition, one occurrence and not two as claimed.


▲Other coverage examples
The graph on the left shows a summary of payments made and remaining balance due. Timeline shows insured was aware of wrongdoing years before new execs decided to claim a loss.
Patent Casework

▲Mobile technology patents
This illustration is typical of a tutorial that is either stand alone for a “science day” type hearing, or to support trial testimony with an orientation to the technology. Here, illustrations are used to show the structure and function of a lithium ion battery.


▲Other breach examples
Left is a 2D animated illustration supporting an orientation to action of oral contraceptives. Right is from a tutorial on how mobile networks transmit information “payloads” in individual packets.

▲Patent case example
This 3D animation was used to inform the court on the structure and function of an accused device and support argument on its non-infringement.


▲Other patent examples
The 2D animation at left was used to argue that transmission for hire does not constitute ownership. 3D example shows mechanism of action of an alleged infringing device.
Product Liability / Personal Injury

▲Product liability example
This 2D animated illustration was used to show the lack of durability of chrysotile fibers in the body. As the bonds between magnesium molecules break down, fibers lose integrity and fall apart.


▲Other product/injury examples
On the left is a 2D animated primer on the products of crude oil fractionation (asbestos case). And a graph showing the tiny size of a defendant’s installation at refinery where plaintiff worked.

▲Other product/injury examples
This 2D-animated illustration is part of a tutorial showing occlusion of a coronary artery with build-up of plaque in the artery walls.


▲Other product/injury examples
On the left, a summary trial board shows evidence of plaintiff’s prior knowledge of a label hazard. The trial board on the right shows the plaintiff’s activities leading to an injury.

▲Other product/injury examples
2D-animated illustrations from a tutorial on kidney function. This to support expert testimony on the action and accused side effects of a prescription drug.
Maritime Dispute Casework

▲Maritime example
This 3D-animated exhibit showed the cause of channel dredging delays: the complex series of time-consuming steps the contractor had to take to accommodate channel traffic. Average delay x average traffic showed entire project delay caused by interruptions.

▲Other maritime examples
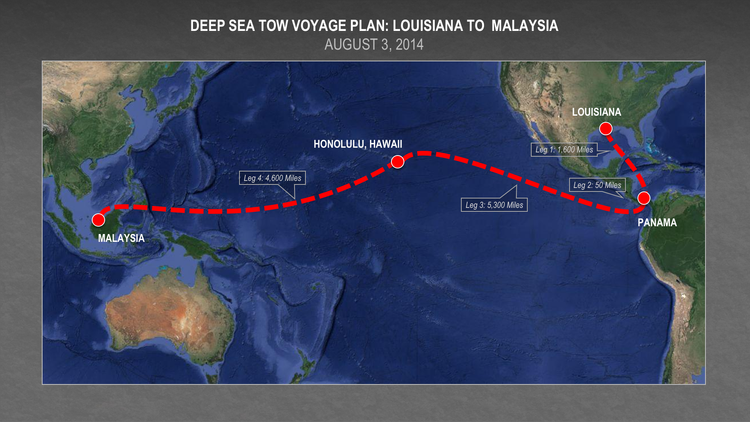
At left is part of a sequence showing the tow plan for transit of a drilling rig from the US to Malaysia. At right a detail showing entry to the Panama Canal after a first stop for repairs.
Civil/Structural Engineering Casework

▲Construction defect example
These illustrations were used in an expert report and opinion deck to show as-designed configuration compared with defect/failure scenarios. Fault appearance indicates cause and which contractor was responsible.


▲Other engineering examples
At left, a 2D sequence showing added weight of asphalt layers leading to probable cause of collapse. At right, a diagram showing limited egress from a warehouse fire.
Damages Casework

▲Damages example
This demonstrative was used to argue the extreme overreach of the plaintiff’s damages demand. Two thousand times a calculated RAND royalty is dramatized with a comparison of one dollar icon compared with a stack of 2,000 icons.


▲Other damages examples
Here another overreach is revealed by correcting the y axis limits to begin at 0 instead of 40%. The defendant is able to use the corrected version to challenge the plaintiff’s expert on cross.